Global dashboard
Published 08 March 2018
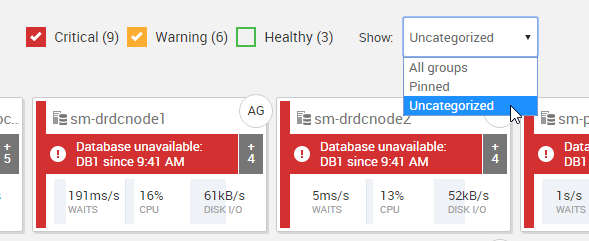
Choosing which servers to view
Filter by severity and group:
Sorting Order
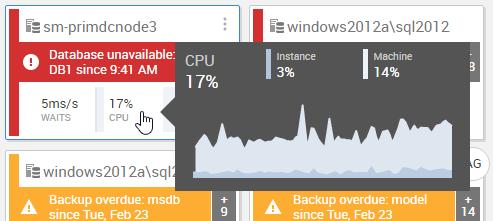
Stacked charts and graphs
Move your mouse over over the statistics to see a stacked graph showing a breakdown of the relevant metric for the past 15 minutes:
Waits
Signal vs resource- CPU
Instance vs machine Disk I/O
Reads vs writes
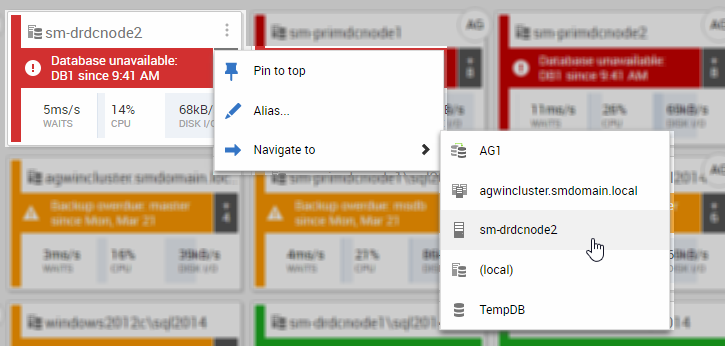
More actions: pinning, aliasing, and navigating to overview pages
Use the  icon to see more actions:
Pin to top
Pinning a server means it will appear in a "Pinned" group above any other groups.- Alias
You can a choose an alias (a friendly name) for the server. Navigate to...
Drill down to an overview page for a different level - cluster, availability group, etc.
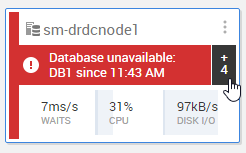
Alert history
The alert history pane on the right shows recent alerts. You can click through to the alert inbox, filtered by alert, or to the main alert inbox.
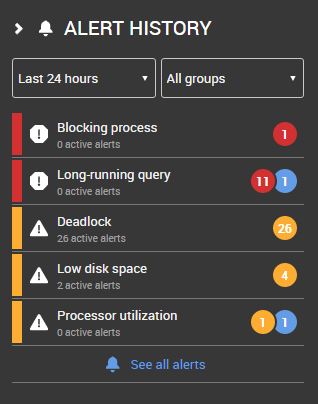
Viewing more
To go to the alert inbox (filtered for this server), click +n.
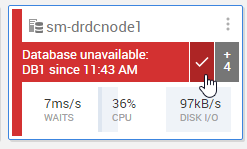
To clear the alert, move your mouse over the alert description and click the check mark.
This documentation contains proprietary information and is protected by copyright law.
Copyright © 2026 Red Gate Software Limited. All rights reserved


