Availability group overview
Published 08 March 2018
Understanding the availability group overview
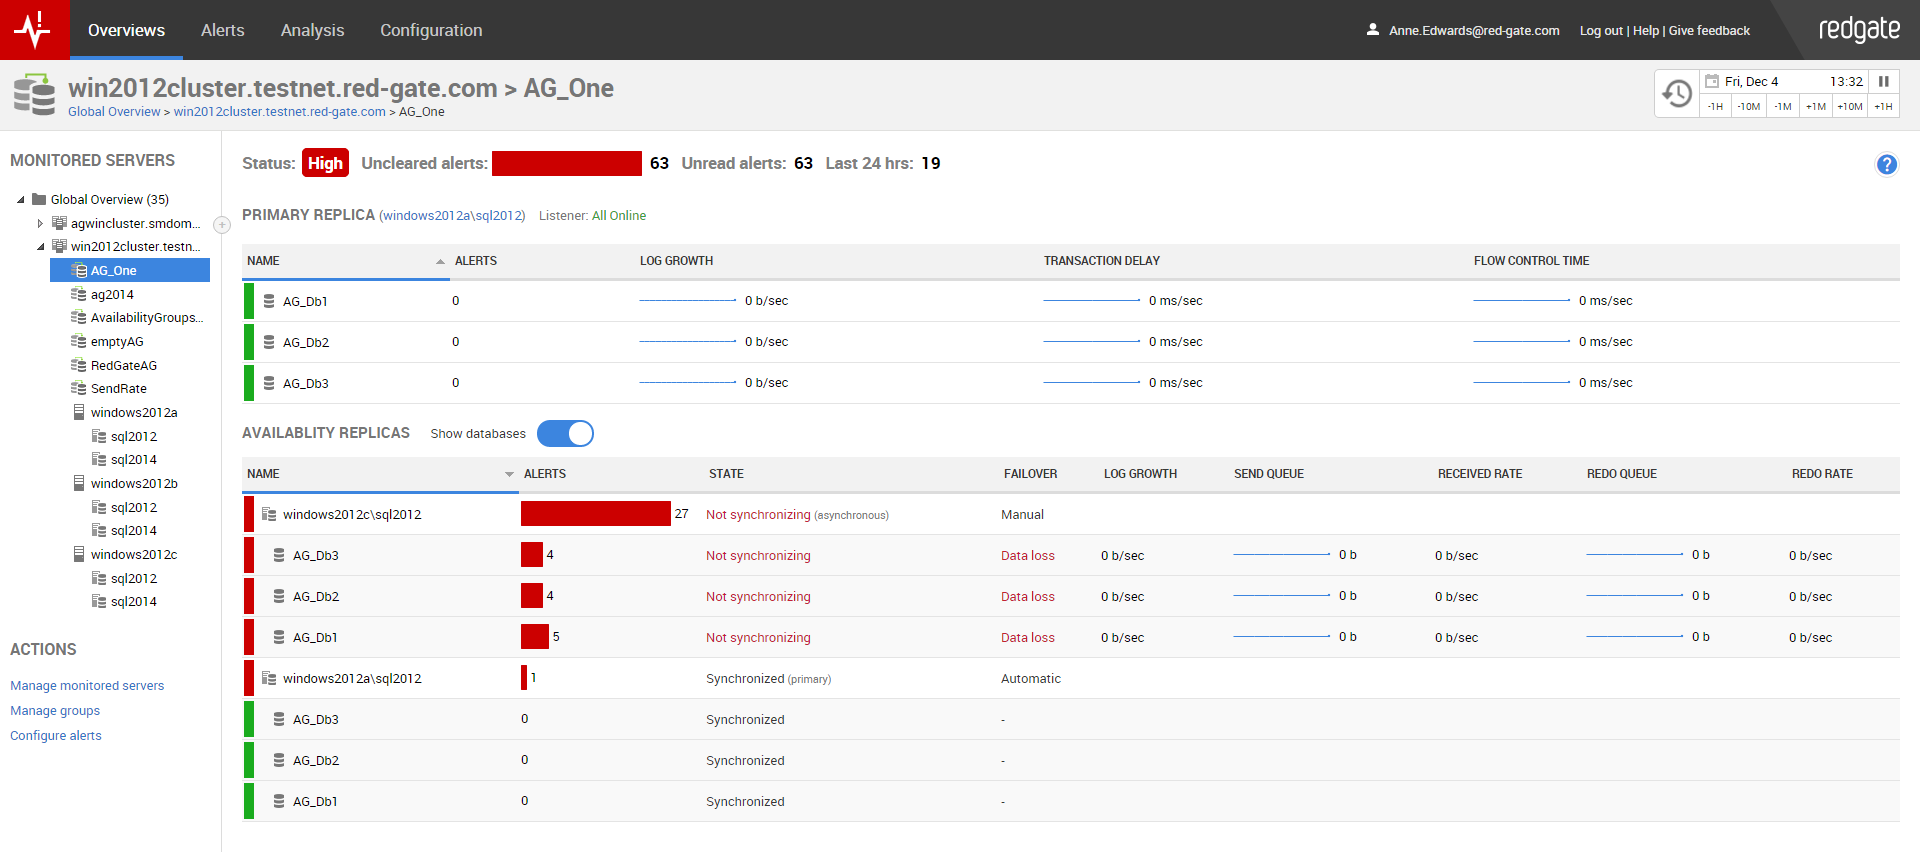
The availability group overview shows all replicas and databases within an availability group. It also shows alerts, states, and failover information for these replicas, and metrics for the databases.
Use the overview to identify and investigate problems with your availability groups, such as unhealthy replicas or databases and bottlenecks in the replication process.
State, commit mode, and failover information
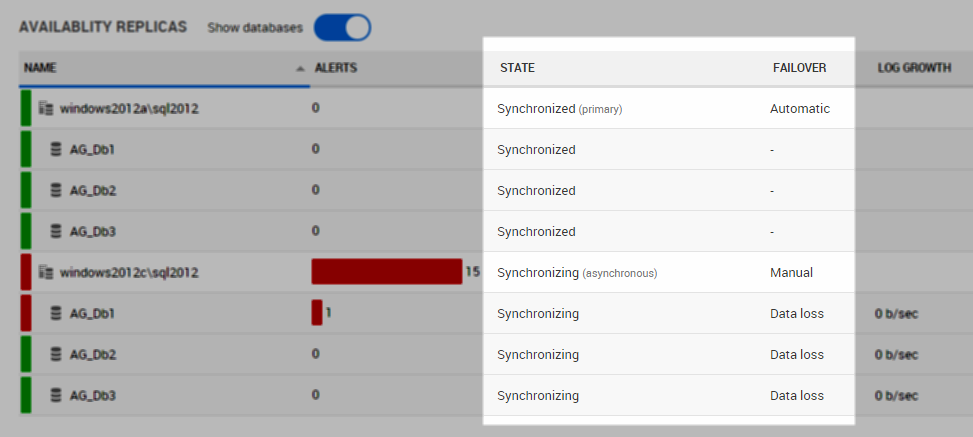
Within the Availability replicas section of the page, there are columns labelled State and Failover.
The State column shows the health state of each replica or database, along with the commit mode in parentheses next to each replica.
The Failover column shows the failover mode for each replica, and failover information for the databases.
For more information, see State, commit mode, and failover informationn.
Investigating the replication process
The Availability replicas section of the overview page shows five database metrics. These metrics represent key stages in the replication process.
For more information about a particular metric, click the metric name.
Log data is flushed to disk on the primary database (log growth) and joins the send queue.
The log growth metric represents the speed at which log records are being added to the send queue, and the send queue represents the amount of log data that has been flushed to disk on the primary but not yet sent to the secondary replica.The Log growth metric on the availability group overview represents the rate of log bytes flushed on the primary replica only, even when it's displayed alongside a database on a secondary replica.
To see the rate of log bytes flushed for a database on a secondary replica, go to the Analysis Graph, select the metric Log bytes flushed/sec, and then select the database.
- From the send queue, log records are sent to the secondary replica.
The received rate measures how quickly the log records are received by the secondary replica. To estimate how long a secondary replica will take to catch up with the primary replica, divide the send queue by the received rate. - On reaching the secondary replica, the log records join the redo queue.
The redo queue represents the amount of log records that needs to be written to the secondary database (redone) for the synchronous-commit primary and secondary replicas to be synchronized. - Log records from the redo queue are written to the secondary database, completing the process.
The redo rate is the rate at which log records are written to the secondary database. If the received rate is higher than the redo rate, the size of the redo queue will increase.
To estimate the time, in seconds, that it will take the secondary replica to redo the log (and therefore how long failover will take), divide the redo queue by the redo rate.
Primary replica: performance metrics
The Primary replica section of the overview page shows three database metrics. These metrics help to identify replication performance issues.
- Log growth measures the average size of the log flush per second.
This metric helps to assess utilization and identify trends of the transaction log. A log flush occurs when data is written from the log cache to the physical transaction log file on disk, every time a transaction is committed. - Transaction delay measures the extent to which transactions are slowed down by synchronous replication.
In synchronous-commit mode, the primary replica doesn't commit any transactions until it receives acknowledgement that all synchronous secondary replicas have finished hardening the log, in order to make sure that if there was a failover, no data would be lost. The transaction delay, therefore, includes the time taken for the primary replica to send log records to the secondary, and for the secondary replica to receive these records, harden them, and send back acknowledgement to the primary replica. - Flow control time throttles the flow of network traffic caused by replication, by limiting the speed at which the primary replica sends log records to the secondary replica.
This helps to even out the usage of network and memory resources.
Interpreting these metrics
Log growth and flow control time both influence the transaction delay:
- The rate of log growth indicates the speed at which the send queue is growing, so if the rate of log growth is higher than the rate at which log records are sent, the send queue will grow. This can be problematic for replicas in synchronous-commit mode, as it adds to the transaction delay: the send queue must be fully depleted and all log records sent and hardened before the primary replica can commit any transactions.
- Flow control time limits the rate at which log records are sent, slowing down the replication process and potentially causing the send queue to grow, which can affect transaction delay.
Transaction delay is also affected by the received rate:
- If the received rate on the secondary replica is high but the rate of log bytes flushed to the secondary replica is low, this indicates that the data is arriving faster than it can be flushed to the secondary database log, causing a bottleneck and adding to the transaction delay.
This documentation contains proprietary information and is protected by copyright law.
Copyright © 2026 Red Gate Software Limited. All rights reserved


