Attaching to a process
Published 14 May 2018
Requirements
Before you can attach profiling to a process, you need to:
- Make sure the process runs on .NET 4.
- Disable concurrent garbage collection and server garbage collection mode.
1. Make sure the process runs on .NET 4
Due to a limitation in older versions of the CLR, you can only attach ANTS Memory Profiler to a .NET 4 process.
If your process runs on an older version of .NET, you may be able to force it to run as .NET 4 without recompiling it. See Forcing your application to use .NET 4.
2. Disable concurrent garbage collection and server garbage collection mode
ANTS Memory Profiler can't monitor garbage collections if they take place in a different thread to the application. To make garbage collection take place in the same thread, disable concurrent garbage collection.
For more information, see Fundamentals of garbage collection: concurrent garbage collection (MSDN).
Disabling concurrent garbage collection affects your application's performance:
- Your application runs faster, but slows briefly whenever garbage collections take place.
- The memory footprint of your application increases slightly, because garbage collection itself uses a small amount of memory.
This difference shouldn't be big enough to affect the profiling results.
ANTS Memory Profiler can't attach to a process running in server garbage collection mode.
To disable concurrent garbage collection and server garbage collection mode, edit the application config file:
Locate the config file.
If you're attaching to a web service running on the web development server, the config file is in %ProgramFiles%/Common Files/microsoft shared/Dev Server/ and is named WebDev.WebServer.exe.config
Otherwise, the config file is in the same directory as the application's executable, with a .config extension. If your application's executable is sample.exe, the configuration file will be sample.exe.config.If you can't find the config file, see If the config file doesn't exist below.Edit the file and add the following XML, inside the
<runtime>node, inside the<configuration>element, and after the</configSections>element if there is one:<runtime> <gcConcurrent enabled="false"/> </runtime>- If the file contains
<gcServer enabled="true"/>, remove this line to disable server garbage collection mode. - Save the config file.
Run your application and then attach ANTS Memory Profiler to it (see Running a profiling session).
- When you've finished profiling, remove the
<gcConcurrent enabled="false"/>line from the config file.
If the config file doesn't exist:
Create a new text file, and copy the following XML into it:
<configuration> <runtime> <gcConcurrent enabled="false"/> </runtime> </configuration>- Save the file in the same directory as the application's executable file. Give it the same name as the executable file, but with the .config file extension.
For example, if your application is sample.exe, name the config file sample.exe.config
You don't need to rebuild your application executable. The .NET CLR will automatically load the configuration file at runtime. - Run your application and then attach ANTS Memory Profiler to it (see Running a profiling session).
- When you've finished profiling, delete the config file.
Running a profiling session
- Start ANTS Memory Profiler and click

- From the list of application types, select Attach to a .NET 4+ process.
All processes running under the same user as ANTS Memory Profiler are shown in a list. Click the process you want to profile:
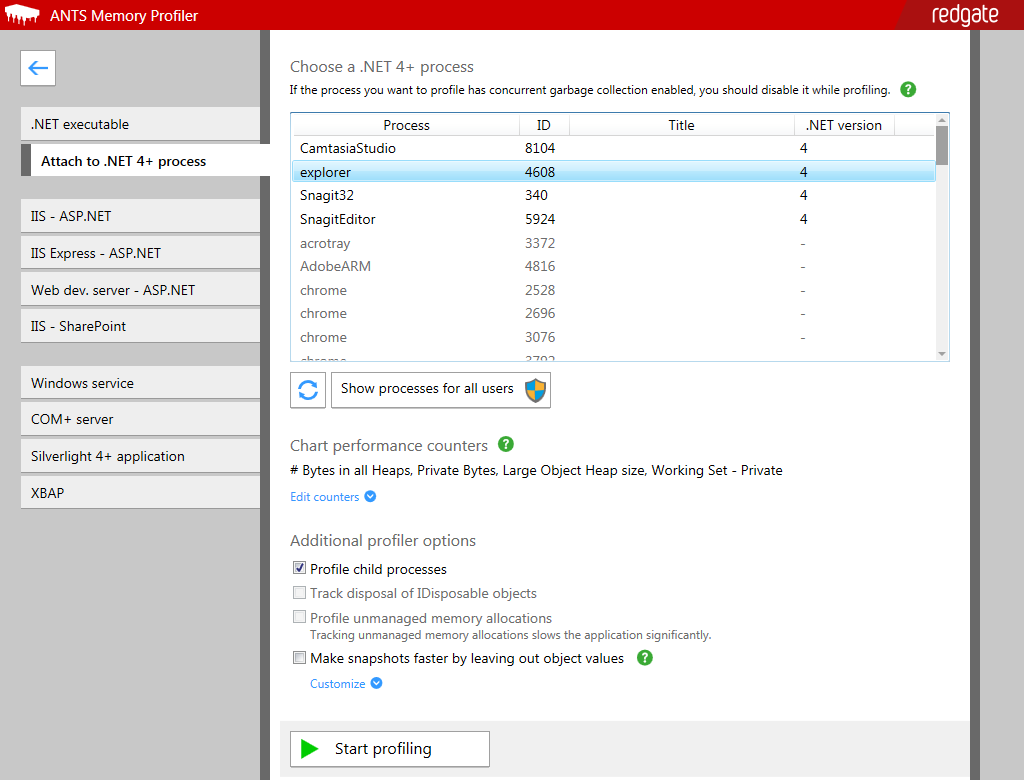 The list includes processes which aren't .NET 4 process, but you can't select them.
Some anti-virus software can stop you from attaching to a process. If you can't find your process in the list, see Cannot attach to process due to anti-virus software.
To show processes from other users, click Show processes for all users. To refresh the list, click Refresh
- If you want to record extra performance counters, click Edit counters and select the counters you want.
Move your mouse pointer over a performance counter to read more about it.
For more information about performance counters, see Setting up performance counters. - Under Additional profiler options:
- Select Profile child processes to include any processes created by your application in profiling.
If your application has lots of child processes, this option will slow down your application. - Track disposal of IDisposable objects and Profile unmanaged memory allocations aren't available when attaching to a process.
To track this information, the application needs to be launched by ANTS Memory Profiler. - Select Make snapshots faster by leaving out object values if you've had problems with snapshots being too slow or too large.
You won't be able to see the values of individual instances, but references between objects aren't affected.
If you want to see the values of strings or the contents of arrays specifically, click Customize and deselect the relevant option.
- Select Profile child processes to include any processes created by your application in profiling.
- Click

The main profiling window is displayed, and ANTS Memory Profiler attaches to the process..
On the timeline, you can see the memory being used by the process, along with any other performance counters you selected. - When your application is in a stable state (ie is ready for normal use), click

A memory snapshot gives you a detailed breakdown of the memory being used at that point in time, so that you can compare it with later snapshots. - When you've taken at least two snapshots, you can start to investigate your application's memory usage. See Strategies for memory profiling.
This documentation contains proprietary information and is protected by copyright law.
Copyright © 2026 Red Gate Software Limited. All rights reserved


