Setting up performance counters
Published 14 May 2018
ANTS Memory Profiler can monitor the values of a number of Windows performance counters while the application you are profiling is executing. The values of these counters are constantly updated on the timeline during profiling.
We recommend using only the default counters. Each additional counter you monitor adds to the overhead introduced by the profiler. Adding too many counters may cause your application to run substantially more slowly.
Choose the performance counters you want to monitor when setting up a profiling session, once you've selected your application type, by clicking Edit counters.
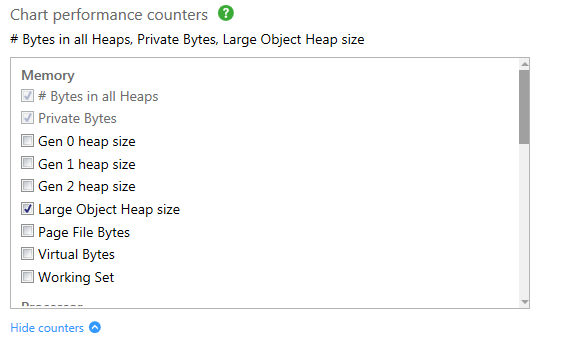
Not all performance counters will be appropriate for the application type you are profiling. You can find more information about individual performance counters by moving your mouse over the name of the performance counter.
You can add custom performance counters to the list of available counters. To do this, see Adding custom performance counters.
Comparing memory counters
There are many ways to measure memory usage. No single counter reveals a complete picture of the memory requirements of your program, and the values of different counters are incomparable.
By default, ANTS Memory Profiler uses the Private bytes counter, because this measure is considered the most useful for most kinds of memory problem.
Windows Task Manager shows the Private working set counter by default. The Private working set is unavailable in ANTS Memory Profiler because it is only accurate immediately after a garbage collection.
The following table summarizes some of the main different ways of measuring memory:
Counter | Description | Including shared processes? | Including memory paged to disk? |
Private bytes | Includes memory allocated (even if not in use) | No | Yes |
Working set | Only includes memory in use | Yes | No |
Virtual bytes | Only includes memory in use | Yes | Yes |
Private working set | Only includes memory in use | No | No |
Performance Monitor (perfmon.exe) has a performance counter called # Bytes in all heaps, which is part of the .NET CLR Memory object.
The value of the Performance Monitor # Bytes in all heaps counter is often larger than the ANTS Memory Profiler # Bytes in all heaps counter. The discrepancy is caused because the Performance Monitor # Bytes in all heaps counter includes memory allocated to the .NET heaps but which is not being used, whilst the ANTS Memory Profiler # Bytes in all heaps only includes memory that is both allocated and in use.
This documentation contains proprietary information and is protected by copyright law.
Copyright © 2026 Red Gate Software Limited. All rights reserved


