The summary page
Published 14 May 2018
The summary page shows an overview of how your application was using memory when you took the current and baseline snapshots.
The summary page is divided into six areas:
- Total size of live objects
- Large object heap fragmentation
Assemblies loaded in the CLR
Only shown in ANTS Memory Profiler 8.2 and later, and if your application uses .NET 4. Not shown when attaching to a process.- .NET and unmanaged memory
- Largest classes
Unmanaged memory breakdown by module
Only shown if you selected Profile unmanaged memory allocations when setting up the profiling session.
Not available on Windows XP / Server 2003 and earlier, or when profiling .NET 1.1 applications.
Total size of live objects
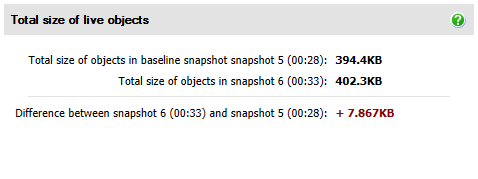
The total size of live objects section shows:
- Total size of objects in baseline snapshot
The amount of memory being used by the .NET heaps at the time of the baseline snapshot. - Total size of objects in current snapshot
The amount of memory being used by the .NET heaps in the current snapshot. - Difference between current snapshot and baseline snapshot
The difference in memory being used between the two snapshots.
If you haven't selected a baseline snapshot, or if you have only taken one snapshot, the Total size of objects in baseline snapshot and Difference between snapshots aren't shown.
Use this information to check how memory usage has changed between the snapshots. To change the snapshots being compared, under the timeline, use the Snapshot and Current drop-down lists. You can name the snapshots; see The timeline.
Large object heap fragmentation
In ANTS Memory Profiler 8.1 and earlier, the large object heap fragmentation section is labeled Memory fragmentation.

The memory fragmentation section shows information about the fragments in all of the memory allocated to .NET:
- Total number of fragments
- Number of large fragments
- Wastage due to small fragments
If small fragments make up a high percentage of free memory, your application probably doesn't have large object heap fragmentation. - Largest fragment
- The profiler's interpretation of fragmentation in your application
See Fragmentation notices in ANTS Memory Profiler 8.1 and earlier.
The large object heap (LOH) can become fragmented over time, because the garbage collector doesn't compact the heap. This can eventually lead to OutOfMemory exceptions. For more information, see Memory management primer: The large object heap.
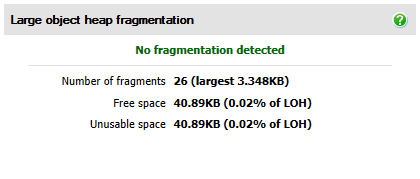
The large object heap fragmentation section shows:
- The profiler's interpretation of fragmentation in your application
See Fragmentation notices. - Total number of fragments (and size of largest fragment)
- Total size of fragments (and this as a percentage of the LOH)
If the percentage of free memory accounted for by fragments is high, and the largest fragment is small, you may have LOH fragmentation. - Unusable memory (and this as a percentage of the LOH)
The total of fragments on the LOH that are smaller than 85k. Only objects larger than 85k (apart from double arrays) are put onto the LOH, so new objects can't be put into this space.
This was called "Wastage due to small fragments" before ANTS Memory Profiler 8.2.
If you're new to memory profiling, we recommend you start by checking for large object heap fragmentation.
If you're profiling an application with more than one process
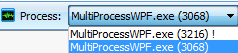
The .NET heaps and garbage collector exist per process, and so it would be meaningless to analyze fragmentation across multiple processes. Use the Process dropdown menu to choose the process to display fragmentation for. It isn't displayed if your application only has one process.
A process followed by an exclamation mark (!) after its name was not running when the current snapshot was taken (either because it had already finished, or because it had not yet started).
Assemblies loaded in the CLR
This section is only shown in ANTS Memory Profiler 8.2 and later. It's not available for .NET 2, or when attaching to a process.
If you want to see the assemblies loaded in a .NET 2 application, see Forcing your application to use .NET 4.
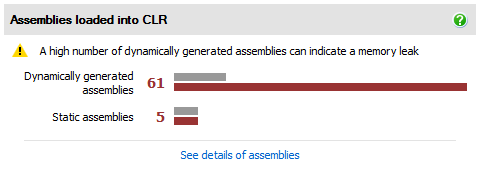
This bar chart shows how many assemblies have been loaded into your application. It warns you if your application has dynamically generated a lot of assemblies, because this can indicate a memory leak.
To find out what these assemblies are, click See details of assemblies to open the Assemblies loaded into the CLR pop-up. See The Assemblies loaded in the CLR pop-up.
If you think your application is leaking dynamically generated assemblies, see Finding a dynamically generated assembly leak.
.NET and unmanaged memory

This pie chart shows the memory used by your program when the current snapshot was taken. If you do not have large object heap fragmentation, use this pie chart to identify whether your problem is caused by an unmanaged or a managed memory problem.
- Generation 1
The size of objects stored on the generation 1 heap (objects that have survived at least one garbage collection). Click the pie chart segment, or the Generation 1 label, to show the classes on the generation 1 heap in the Class List. - Generation 2
The size of objects stored on the generation 2 heap (long-lived objects that have been promoted from the generation 1 heap). Click the pie chart segment, or the Generation 2 label, to show the classes on the generation 2 heap in the Class List. - Large Object Heap
The size of objects stored on the large object heap (mainly arrays larger than 85kB). Click the pie chart segment, or the Large Object Heap label, to show the classes on the large object heap in the Class List. - Unused memory allocated to .NET
The amount of memory which is currently available for .NET. - Unmanaged
The amount of unmanaged memory used by your program.
The generation 0 heap isn't usually shown because taking a snapshot forces a garbage collection. Generation 0 only appears on the pie chart when there are objects which haven't survived any garbage collections and are on the finalizer queue when the memory snapshot was taken.
Largest classes

This section shows which classes are using the most memory. Click on a class name to see the instance categorizer for that class.
After you've determined that you have a managed memory problem, and if you aren't sure which class is causing the problem, we recommend you investigate the largest classes. For more information, see Finding out what is using most memory.
Unmanaged memory breakdown by module
This section is only shown if you select Profile unmanaged memory allocations when setting up the profiling session. It's not available on Windows XP / Server 2003 and earlier, or when profiling .NET 1.1 applications.

This section shows which modules used by your application allocated the most unmanaged memory, in the current and the baseline snapshot.
Technically, all unmanaged and managed allocations are made by kernel32.dll. ANTS Memory Profiler looks further up the stack trace to find a module that's more relevant to your code, such as a third party library you're using.
Move the mouse over a module to see its full name. Click Other modules to see all the modules.
If you're not using much unmanaged memory, the biggest module is likely to be clr or mscorworks, which is the .NET Common Language Runtime.
Look for modules which:
- are continually growing
- stay the same size when they should be getting smaller
- hold on to memory even when your application has finished using them
Two other types of allocation are shown on the chart:
- Allocated before profiling started
This is the size of unmanaged allocations that have already been made at the time profiling started.
ANTS Memory Profiler needs to observe unmanaged allocations when they're first made in order to track them. If there are unmanaged allocations made before profiling starts, the profiler can observe their size when profiling starts, but it can't track any changes in size.
There will always be some allocations made before profiling starts, even if you launch an application from the profiler. This is because the CLR loads, using unmanaged memory, before profiling can begin. - Allocated by managed code
These are unmanaged memory allocations made directly by managed code, for example usingMarshal.AllocHGlobal()or a similar method. If this is continuously growing, check for unmanaged memory allocations that don't have a corresponding call toMarshal.FreeHGlobal()to free the memory.
This documentation contains proprietary information and is protected by copyright law.
Copyright © 2026 Red Gate Software Limited. All rights reserved


