Finding a dynamically generated assembly leak
Published 03 December 2013
Information about dynamically generated assemblies is only shown in ANTS Memory Profiler 8.2 and later. It's not available for .NET 2 or earlier, or when attaching to a process.
If you want to see the assemblies loaded in a .NET 2 application, see Forcing your application to use .NET 4.
Profiling unmanaged memory isn't available on Windows XP / Server 2003 and earlier, or when profiling .NET 1.1 applications.
This page explains how to find out if your application is leaking dynamically generated assemblies, and how to find the cause of the leak.
Dynamically generated assemblies are created by your application at runtime. System.Reflection.Emit or System.CodeDom.Compiler are often used to generate code.
It's possible to accidentally create many copies of a dynamically generated assembly. This causes a memory leak because only one copy of the assembly will be used by your application, and once assemblies are loaded, they can't be unloaded (unless ithey were loaded into a separate AppDomain). This means that assemblies stay in memory even if they're not used.
The leak appears on the CLR's loader heaps, which is where assemblies that have been loaded into memory are stored.
1. Taking memory snapshots
Before you can investigate whether your application is leaking dynamically generated assemblies, you need to take snapshots of the memory your application is using.
- Set up the profiling session. Under Additional profiling options, select Profile unmanaged memory allocations.
- Click

- Once your application has loaded into a stable state, click
 to take a baseline memory snapshot.
 - Use your application normally.
If you have a particular memory problem in mind, and have steps to reproduce that problem, follow those steps.
For example, if you think the problem is associated with a dialog box, open the dialog box. - Click again.
2. Checking the symptoms of a dynamically generated assembly leak
These are the main symptoms of a dynamically generated assemblies leak. If your application displays most of these symptoms, it may be leaking dynamically generated assemblies.
- On the timeline, when you followed the steps to replicate your memory problem, the Private Bytes counter went up.
- On the timeline, when you took a memory snapshot, the Private Bytes counter stayed at roughly the same level:
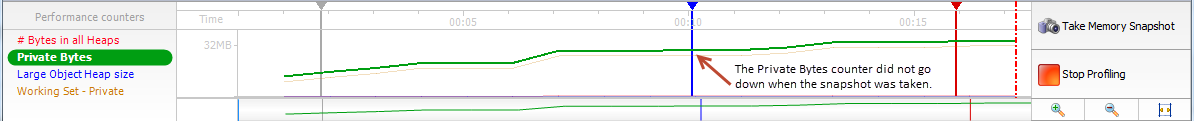
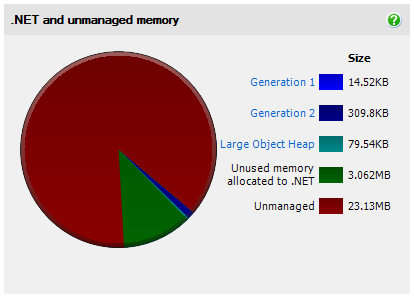
Taking a snapshot triggers a garbage collection, so if there's not a memory problem, memory usage should go down when a snapshot is taken. - On the summary page, on the .NET and unmanaged memory pie chart, the Unmanaged section is the largest section:
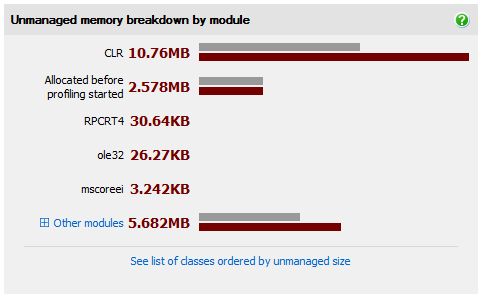
- On the Unmanaged memory breakdown by module bar chart, the CLR is the biggest module, and has grown a lot between snapshots:
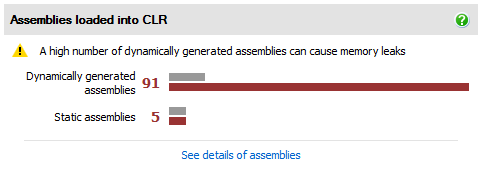
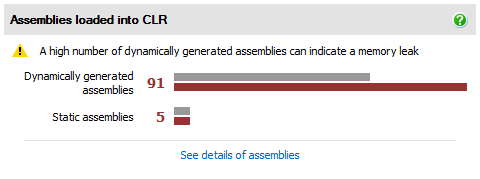
On the Assemblies loaded into CLR bar chart, there's a warning that there are a high number of dynamically generated assemblies:
None of these symptoms guarantee that your application has a dynamically generated assemblies leak. However, if your application displays most of these symptoms, it's worth continuing to the next section and (investigating the assemblies).
Otherwise, continue checking unmanaged memory usage.
3. Finding out what the dynamically generated assemblies are
Because dynamically generated assemblies are created at runtime, they don't have meaningful names. The easiest way to find out what these assemblies are is to look at the code that created them:
- On the Assemblies loaded into CLR bar chart, click See details of assemblies.
The Assemblies loaded in the CLR pop-up opens. This pop-up gives details of all the assemblies loaded into your application: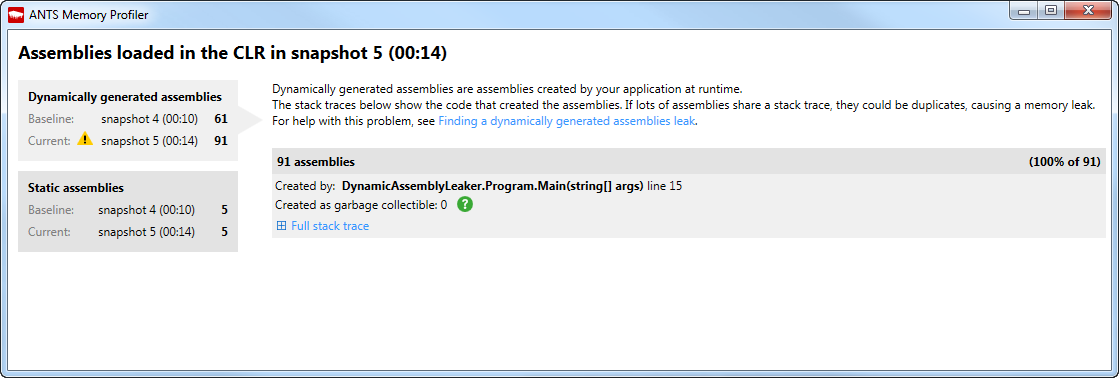
Dynamically generated assemblies are grouped by the stack trace at the time they were created. Assemblies that were created by the same stack trace are likely to be duplicates. - On the biggest group of assemblies, look at what line of code created the assemblies in that group.
To see the stack trace that created a group of assemblies, click Full stack trace. - Find that line of code in your application's source code and check that it's not creating multiple copies of the same assembly.
If the code being called is from a Microsoft library or another third party, you'll need to read the documentation.
How to fix the leak depends on the code causing the problem. Here's an example problem with XmlSerializer, a Microsoft class with a known issue.
Example: fixing an XmlSerializer leak
After following the steps above, we find that all the dynamically generated assemblies were created by this stack trace:
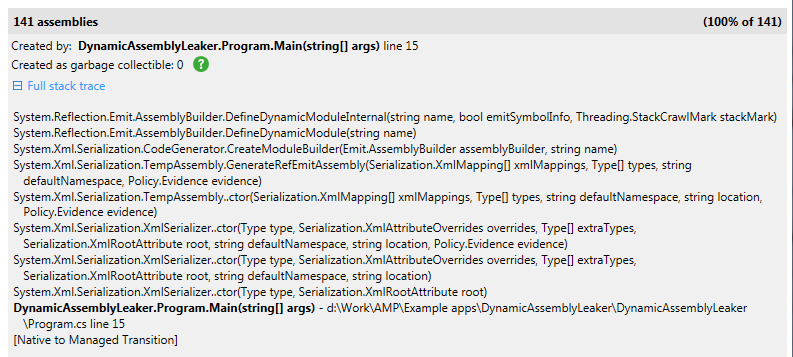
The code in the application is using XmlSerializer. This is the line of code causing a dynamically generated assembly leak in this example:
var serializer = new XmlSerializer(typeof(SomethingToSerialise), new XmlRootAttribute(""));- Go to the MSDN page on the XmlSerializer Class, and scroll down to Dynamically Generated Assemblies.
To avoid generating duplicate assemblies, we need to either:- use one of the basic constructors, or
- cache the assemblies in a hashtable.
Look at the line of code above. The code is using the constructor XmlSerializer(Type, XmlRootAttribute), which is not one of the basic constructors.
This means that the problem can be fixed by using the basic constructor XmlSerializer Constructor (Type) instead:var serializer = new XmlSerializer(typeof(SomethingToSerialise));
Now, the application only creates one dynamically generated assembly, instead of creating many duplicates of the same assembly.
More resources on dynamically generated assemblies
If you have an issue with dynamically generated assemblies and this page hasn't solved your problem, or if you want to find out more about dynamically generated assemblies, these resources might help:
- Microsoft documentation on assemblies: Assemblies in the Common Language Runtime.
This page includes some information about what dynamically generated assemblies are. - Tess Ferrandez's blog on XmlSerializer: .NET Memory Leak: XmlSerializing your way to a Memory Leak.
This post explains another way to find out what the dynamically generated assemblies being leaked by an application are. - Microsoft Support article on XmlSerializer: Memory usage is high when you create several XmlSerializer objects in ASP.NET.
- Tess Ferrandez's blog on XslCompiledTransform: .NET Memory Leak: XslCompiledTransform and “leaked” dynamic assemblies.
XslCompiledTransform is another Microsoft class that can cause dynamically generated assembly problems. - Microsoft documentation on how to make dynamically generated assemblies garbage collectible: Collectible Assemblies for Dynamic Type Generation.
This documentation contains proprietary information and is protected by copyright law.
Copyright © 2026 Red Gate Software Limited. All rights reserved


