Checking unmanaged memory usage
Published 17 December 2012
Unmanaged memory profiling isn't available in Windows XP / Server 2003 and earlier, or when profiling .NET 1.1 applications.
Before you check your application's usage of unmanaged memory, we recommend you check for fragmentation of the large object heap.
If you're not familiar with memory profiling, you might want to read about the .NET heaps before you start.
To check for unmanaged memory usage
- Set up the profiling session. Under Additional profiling options, select Profile unmanaged memory allocations.
- Click

- Once your application has loaded into a stable state, click
- If you can follow steps to replicate a particular memory problem, follow the steps.
For example, if you think you have a memory problem which is associated with a dialog box, open the dialog box. - Click again.
- On the summary screen, look at the .NET and unmanaged memory pie chart.
If there is a large amount of unmanaged usage, you may want to investigate it.
If you don't have a large amount of unmanaged memory use, continue checking managed memory use.
Identifying the cause of high unmanaged memory usage
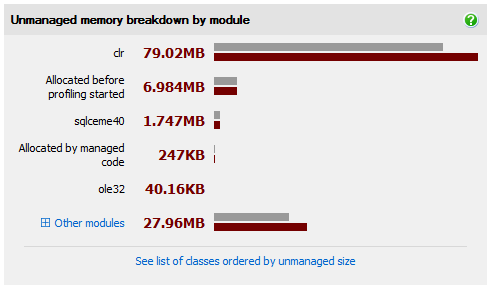
Look at the Unmanaged memory breakdown by module to investigate the cause of high unmanaged memory usage.
Possible causes include:
The Common Language Runtime (CLR)
The CLR itself uses about 40MB of unmanaged memory. If the amount of memory your application uses is 40MB or less, unmanaged memory may seem to take up a large proportion of the memory in use.
In this case, on the Unmanaged memory breakdown by module, the CLR (clr.dll or mscorwks.dll) is likely to be the largest module.
If most of your application's unmanaged memory is associated with the CLR, it's unlikely that you have an unmanaged memory problem. Continue checking for managed memory usage.
ANTS Memory Profiler 8.2 and later only
A dynamically generated assemblies leak can cause the CLR to use lots of memory. In ANTS Memory Profiler 8.2 and later, if your application uses .NET 4, you can see if high CLR memory use is due to dynamically generated assemblies. See Finding a dynamically generated assembly leak.
Accessing unmanaged data through P/Invoke or COM+
You can see which modules are being called from your managed code on the Unmanaged memory breakdown by module.
In general, problematic modules are those which are either continually increasing in size, or which stay constant after your code has finished using them.
To find a module which is causing a problem:
- On the Unmanaged memory breakdown by module, look at the largest modules.
- For each of the largest modules, try to identify the actions in your application, or the areas of your code, which use the module.
For example, if a module is used in a particular dialog box, open and use the dialog box. - For each action, take a snapshot, perform the action, and then take another snapshot.
You may want to perform the action several times before taking the second snapshot. - Look at the unmanaged memory used by the module in the second snapshot, after the action is complete and your code should have finished using the module.
If the module's unmanaged memory usage hasn't dropped, this module could be the cause of a problem. - Go back to where your code uses that module, and check that it's being called correctly.
For example, there may be a cleanup method that you should call.
Graphics buffers
To check unmanaged memory usage due to graphics buffers:
- Switch to the Class List.
- On the Filters panel, switch to the Filter by Object Type.
- Select Objects that implement, click Add class / interface, then choose the appropriate graphics class for your application type:
- For WinForms applications, choose System.Image.
- For WPF applications, choose System.Windows.Media.Imaging.BitmapImage.
- Switch to the Instance list and sort it by Distance from GC root.
- Look at the instances which are furthest from the GC Root. Leaked images are likely to be further from the root.
- Use the instance retention graph to work out why each image is still in memory.
- If you do not see the cause of the memory problem, and if your application is a WinForms application, repeat the steps above using Objects that implement System.Windows.Media.Imaging.CachedBitmap.
- If the objects that implement System.Windows.Media.Imaging.CachedBitmap filter does not show the cause of the memory problem, repeat the steps again using Objects that implement System.Windows.Media.ImageSource.
We recommend that you do not use the instance categorizer for this investigation, because the categorization will tend to emphasize large numbers of small images. It may not show small numbers of large images.
In the instance list, all images will appear to be the same very small size (24 bytes in the case of System.Image objects). This is only the amount of managed memory used to create the pointer to the image.
Look at the Unmanaged size column to for the size of the image itself.
This documentation contains proprietary information and is protected by copyright law.
Copyright © 2026 Red Gate Software Limited. All rights reserved


