Memory management primer
Published 11 December 2012
This page is an overview of .NET memory management. It should give you enough information about how .NET allocates objects into memory to start using ANTS Memory Profiler.
Large and small objects
.NET handles large objects and small objects differently:
- Large objects are all objects over 85k, and double (multidimensional) arrays over 8k.
- All other objects are small objects.
The small object heaps
Small objects are stored in the small object heaps.
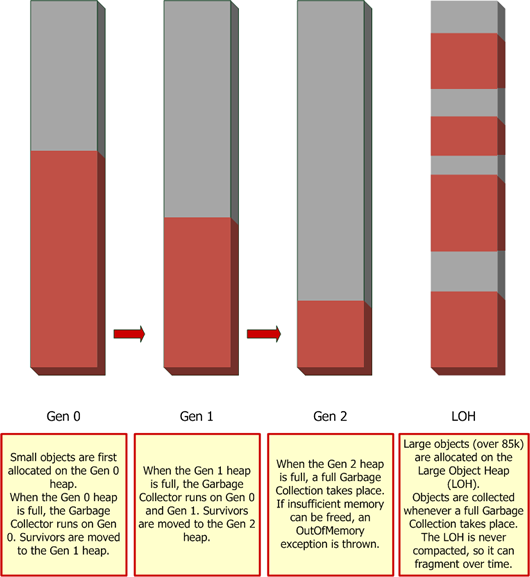
Small objects are allocated first to the generation 0 (Gen 0) heap. When the Gen 0 heap is full, the .NET garbage collector runs. The garbage collector:
- Disposes of all objects on the Gen 0 heap that are no longer in use.
- Moves objects that are still in use to the generation 1 (Gen 1) heap.
This leaves the Gen 0 heap empty, ready for new objects to be allocated on it.
When the Gen 1 heap becomes full, the garbage collector runs again. This time it:
- Disposes of all objects on the Gen 1 heap that are no longer needed.
- Moves objects that are still needed to the generation 2 (Gen 2) heap.
- Performs a garbage collection on the Gen 0 heap, as above.
When Gen 2 becomes full, a full garbage collection takes place. In a full garbage collection, the garbage collector:
- Disposes of all objects on the Gen 2 heap that are no longer in use.
- Performs a garbage collection on Gen 1, as above.
- Performs a garbage collection on Gen 0, as above.
- Disposes of objects on the large object heap that are no longer needed (see below).
If, after a full garbage collection, not enough memory has been freed to allocate new objects, an OutOfMemory exception is thrown.
Note that the garbage collector always compacts the small object heaps, moving objects that are still in use into the space left by objects that have been removed. This means that the free space is used efficiently.
This generational approach means that recently-allocated objects will be disposed sooner than older objects, which are presumed to be being kept in memory for a reason. It also means that full garbage collections, which have the greatest impact on an application's performance, happen as infrequently as possible.
Garbage collection during snaphots
ANTS Memory Profiler triggers a garbage collection when you take a snapshot. This is because some of the memory counters that ANTS Memory Profiler obtains from Windows are only accurate immediately after a garbage collection. This means you generally won't see any objects on the Gen 0 heap during profiling. This behavior doesn't affect the profiling results, because an object which only exists on Gen 0, and which never survives to Gen 1, will never cause a .NET memory problem.
If you do see objects on the Gen 0 heap, it's because the .NET garbage collector doesn't always behave in the way described in this simplified overview. For example, pinned objects, objects on the finalizer queue and objects created during the garbage collection might remain on the Gen 0 heap after a snapshot. Again, this is never a problem that would affect the profiling results.
The large object heap
Large objects are stored on the large object heap.
There is only one large object heap, and objects stored on it are only garbage collected during a full garbage collection.
The large object heap is never compacted, because compacting the large object heap has a high performance overhead. This means that the heap can fragment over time, with lots of free space existing as fragments between objects, rather than as a single contiguous block. If a new object needs to be allocated on the heap, and it's bigger than an existing fragment of free space, the large object heap will grow, so the new object can be allocated to the end of the heap. Eventually, the fragmentation may mean that there isn't enough memory to allocate new large objects, leading to an OutOfMemory exception.
Large object heap fragmentation can be one of the most difficult .NET memory problems to solve. For more information, see how to check for large object heap fragmentation.
If you're using .NET 4.5.1, you can choose to compact the large object heap. See GCSettings.LargeObjectHeapCompactionMode Property (MSDN) for more details.
Further information on large object heap fragmentation
- The dangers of the large object heap
http://www.simple-talk.com/dotnet/.net-framework/the-dangers-of-the-large-object-heap/ - Large object heap uncovered (MSDN)
http://msdn.microsoft.com/en-us/magazine/cc534993.aspx - Understanding garbage collection in .NET
http://www.simple-talk.com/dotnet/.net-framework/understanding-garbage-collection-in-.net/
Managed memory leaks
The garbage collector calculates whether or not an object can be disposed from one of the heaps by creating a graph (similar to the Instance Retention Graph in ANTS Memory Profiler), which shows how the object is referenced by other objects.
The graph starts from the GC roots. A GC root can be any storage slot to which the running program has access, such as a local variable, static variables, or even a CPU register. (Strictly speaking, the object itself is not the GC root; the storage slot that holds the reference to the object is the GC root.)
The GC roots will reference objects, which in turn typically reference other objects (through a member variable). If an object is not being referenced by anything, it cannot be reached by your program, and will be removed by the garbage collector.
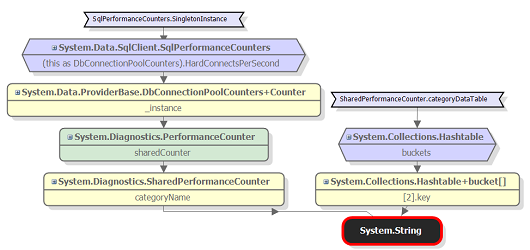
In the graph above, System.String is referenced by:
- The key of
System.Collections.Hashtable+bucket[2].System.Collections.Hashtable+bucket[]is referenced by thebucketsproperty ofSystem.Collections.Hashtable.System.Collections.Hashtableis a GC root because it is referenced by the static variableSharedPerformanceCounter.categoryDataTable.
- The
categoryNameproperty ofSystem.Diagnostics.SharedPerformanceCounter.System.Diagnostics.SharedPerformanceCounteris referenced by thesharedCounterproperty ofSystem.Diagnostics.PerformanceCounter.(The green background means thatSystem.Diagnostics.PerformanceCounteris disposable, but not yet disposed.)System.Diagnostics.PerformanceCounteris referenced by the_instanceproperty ofSystem.Data.ProviderBase.DbConnectionPoolCounters+Counter.System.Data.ProviderBase.DbConnectionPoolCounters+Counteris referenced by theHardConnectsPerSecondproperty of the base classDbConnectionPoolCountersinSystem.Data.SqlClient.SqlPerformanceCounters.System.Data.SqlClient.SqlPerformanceCountersis a GC root because it is referenced by the static variableSqlPerformanceCounters.SingletonInstance.
Because references hold objects in memory, you have to be careful to ensure that references to objects are removed when no longer needed. A common mistake, for example, is to leave an event handler (such as a timer) referencing an object. This will stop the garbage collector from disposing the object. The result is that an object which should have been in memory only briefly can end up leaked onto the Gen 2 heap. Importantly, in this scenario, all of the objects that the object references will also be on the Gen 2 heap. This has significant implications on how you use ANTS Memory Profiler: the objects referenced by the leaked object will often be more obvious than the leaked object itself, so you need to start by investigating those referenced objects (which are most commonly strings or byte arrays).
The typical symptom of a memory leak is that the performance degrades while the program runs but the amount of memory used recovers on restart and then degrades again.
See finding and fixing a memory leak.
Further information on finding leaks in managed code
- Identify and prevent memory leaks in managed code (MSDN)
- Garbage Collection: Automatic Memory Management in the Microsoft .NET Framework (MSDN)
- Memory Management in .NET
Unmanaged memory leaks
Managed .NET code can interoperate with unmanaged code when COM objects or native-code DLLs are invoked. Unmanaged memory problems can occur when managed code is not calling the unmanaged module correctly, for example, if you've forgotten to call a cleanup method. They can also occur if there is a problem in the unmanaged module itself.
One indication of an unmanaged memory leak is when the number of private bytes (the amount of real and paged memory requested by the program) increases more quickly than the number of bytes in the .NET heap.
To find the source of the leak, look for modules where the memory usage is growing when it should be staying constant, or staying constant when it should be getting smaller.
You can also look for .NET classes which have a large amount of unmanaged memory associated with them, or look for objects on the finalizer queue that have not been disposed.
See checking for unmanaged memory usage.
Further information on finding leaks in unmanaged code
Webinar
This page should have given you enough knowledge to start using ANTS Memory Profiler. If you are interested in learning about .NET memory in more detail, see our webinar 5 Misconceptions about .NET Memory Management.
This documentation contains proprietary information and is protected by copyright law.
Copyright © 2026 Red Gate Software Limited. All rights reserved


