Using the Visual Studio Add-in
Published 14 May 2018
The ANTS Profiler Visual Studio Add-in allows you to launch ANTS Performance Profiler directly from your IDE. Version 3 of the add-in supports Visual Studio 2015 and later.
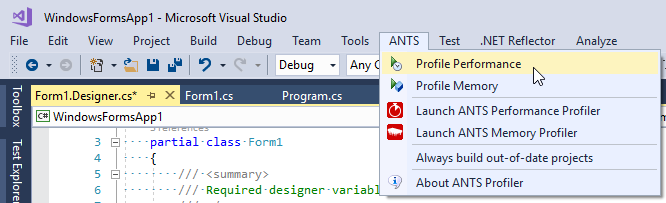
Installing the add-in adds a new ANTS menu in Visual Studio. If you also have ANTS Memory Profiler installed, both profilers will be available under this menu.The Visual Studio Add-in is a separate program from ANTS Performance Profiler, and is installed by default as part of Redgate's .NET bundles.
If you purchased ANTS Performance Profiler as a standalone product, you might not have the Add-in. In that case, install the Add-in by searching for ANTS Profiler Visual Studio Add-in in the Visual Studio's Extensions and Updates menu or download the latest version directly from Visual Studio Marketplace.
[Get the ANTS Profiler Visual Studio Add-in for Visual Studio 2015 ,2017 and 2019]
[Get the ANTS Profiler Visual Studio Add-in for Visual Studio 2022 and 2026]
You do not need a new license for the Add-in, and the Add-in will not expire when the bundle's trial period ends.
Profiling performance with ANTS Performance Profiler
If you want to profile your application right away, under the ANTS menu select Profile Performance to profile your project.
If your project was never built, or if something has changed and the resulting assembly is out-of-date, you'll be asked to build the project.
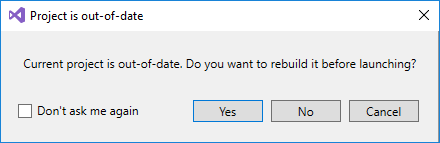
You can click Yes to automatically build the project and run the profiling session after the build is completed. If you click No, an old version of assembly will be profiled.
Launching ANTS Performance Profiler from Visual Studio
If you want to fine-tune profiling session's settings, you can click Launch ANTS Performance Profiler instead. APP will be launched with some fields pre-filled. You can then change some settings and click Start profiling whenever you're ready.
This documentation contains proprietary information and is protected by copyright law.
Copyright © 2026 Red Gate Software Limited. All rights reserved


