Attaching to a running .NET 4 process
Published 14 May 2018
ANTS Performance Profiler can not attach to Windows Store apps that are already running.
ANTS Performance Profiler can attach to a .NET 4 (including .NET 4.5) process which is already running. This allows you to start profiling your applications when performance problems are noticed, without having to restart the application. To profile a running process you select it, choose your options, and click start. Only one profiling method is available for running processes: Sample method-level timings.
If your application doesn't target .NET 4, it may still be possible to force it to run as .NET 4 so that you can attach to it. You can only do this if you haven't hard-coded any references to specific .NET versions in your code. For more information, see Forcing your application to use .NET 4.
This page explains how to profile a running process, using a simple C# program (called Net4Process.exe), which counts down for 300 seconds:
using System;
using System.Collections.Generic;
using System.Linq;
using System.Text;

namespace Net4Process
{
    class Program
    {
        static void Main(string[] args)
        {
            Console.WriteLine("Countdown test process");
            int i = 300;
            int[] array = new int[301];
            while (i >= 0)
            {
                Console.WriteLine(i + " seconds");
                array[i] = i;
                i--;
                System.Threading.Thread.Sleep(1000);
            }
        }
    }
}- Start Net4Process.exe from the command prompt.
- When the countdown starts, open ANTS Performance Profiler.
- On the startup screen, click New Profiling Session.
On the settings screen, click Attach to a .NET 4+ process.
A list of the processes currently running is displayed with the .NET framework version that they use: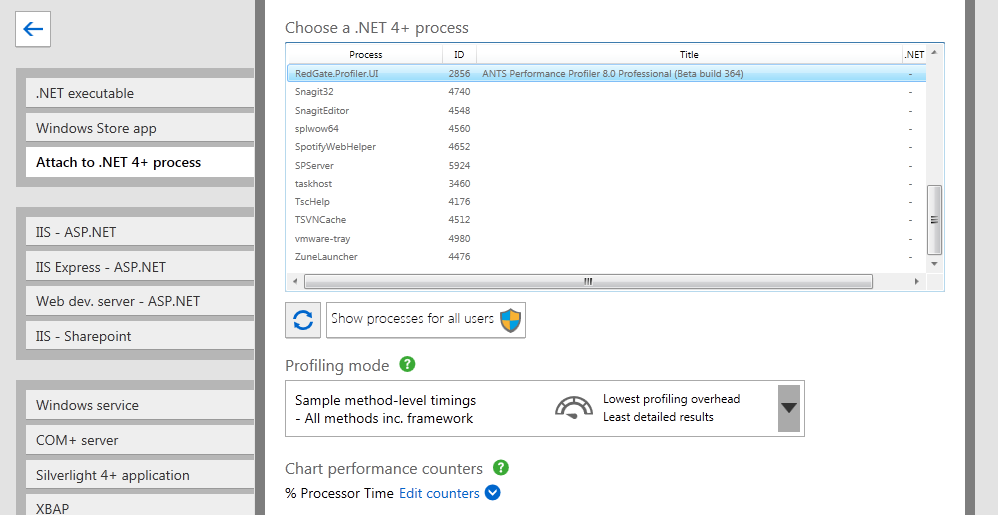
Processes that are not .NET 4 processes are unavailable
When you attach to a .NET 4 process, Sample method-level timings are always used.
- Select Net4Process and click Start Profiling.
The profiler begins collecting results from the process.
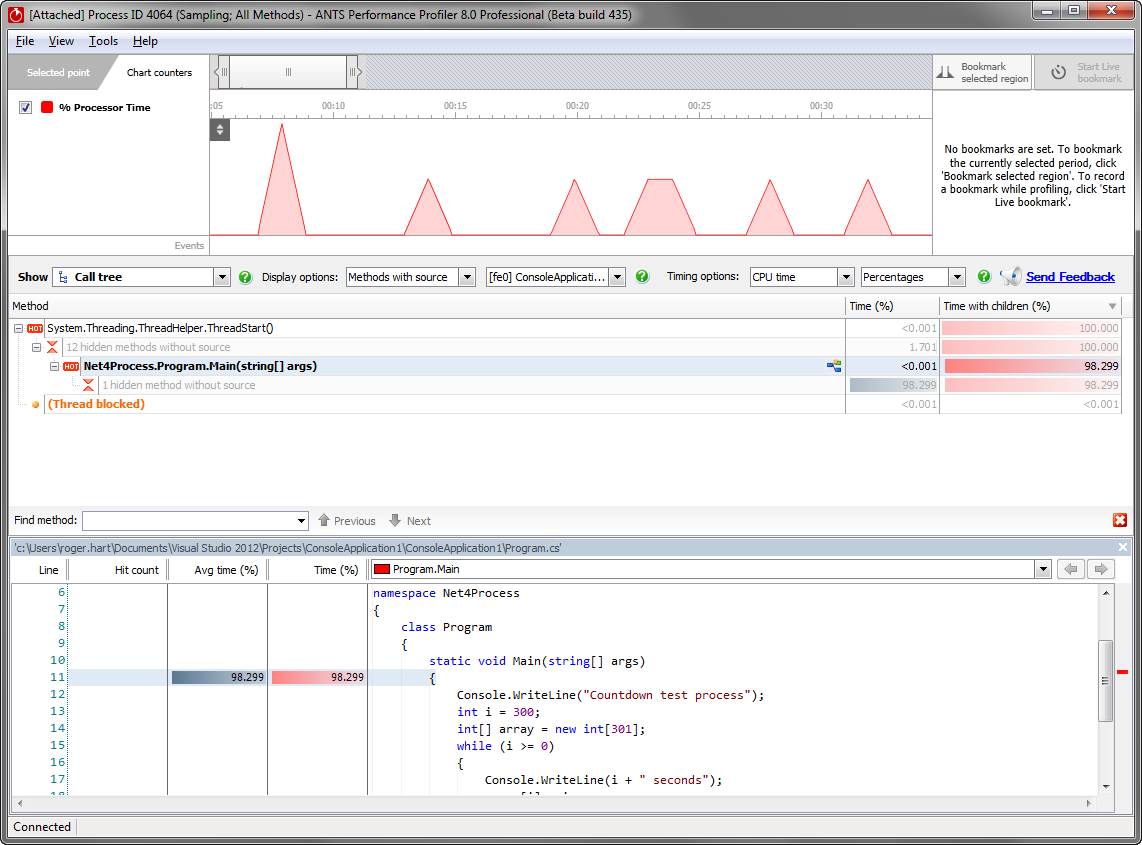
When the application has finished (or if you press ANTS Performance Profiler's button to stop profiling), the results are shown in the call tree in ANTS Performance Profiler.
As expected, almost 100% of the time is spent in Main().
If you need to save results for analysis later, attaching ANTS Performance Profiler to a running process means that you can save just the results you need, helping to reduce the size of the results file.
Tips and troubleshooting
If you attach the profiler to a .NET 4 WinRT process, profiling will fail.
This is because the profiler cannot currently tell which processes are WinRT processes, and so all processes are displayed in the list.


