Profiling from the command line (API)
Published 03 December 2012
You can profile applications from the command prompt in ANTS Performance Profiler Professional.
To run a profiling session from the command prompt, run Profile.exe with the appropriate options.
For example, to profile an executable called SimpleApp.exe using line-level timings and saving results as a CSV, use:
Profile.exe /e:"C:\testing\SimpleApp.exe" /ll /csv:"C:\testing\results.csv"
Profiling applications from the command prompt is useful if you want to integrate performance profiling in an automated test procedure; see Integrating ANTS Performance Profiler in a test procedure.
Profiling IIS from the command line
You cannot currently profile applications which run on IIS 5, 6, 7, or 7.5 from the command line. To work around this limitation:
- Profile IIS from the ANTS Performance Profiler graphical user interface.
- When you have finished profiling, on the File menu, click Save Project.
- Use the
/projectargument on the command line to load the saved project. - Interact with your application (e.g. through a web browser or client application - this can be manually or via automated calls, if your application can be run from the command line). This is necessary to execute the managed code that the profiler will profile.
Applications in IIS Express, however, can be profiled directly from the command line. Arguments for IIS Express profiling are included below.
List of command line arguments
/help (Alias: /?)
Displays this help message. Use in conjunction with /verbose for more detailed information.
If this switch is used with any switches other than /verbose, /html, /out, /force or /outputwidth then those switches will be ignored, the help message will be printed, and 0 will be returned as the process exit code.
/html
Causes help to be output as HTML.
Must be used with the /help switch.
/quiet (Alias: /q)
Quiet mode - no output.
/verbose (Alias: /v)
Verbose mode.
/force (Alias: /f)
Forces overwriting of output files that already exist. If this flag is not set and a file already exists then program will exit with an exit code indicating an I/O error.
/argfile:<argfile>
File containing the XML argument specification.
/out:<fileName>
Redirects console output to the specified file.
/project:<project> (Alias: /p)
A performance profiler project that should be used to begin profiling.
/executable:<executable> (Alias: /e)
An executable to run in the profiler.
/arguments:<arguments> (Alias: /args)
The arguments to pass to the executable.
/workingDirectory:<workingDirectory> (Alias: /wd)
The working directory to use when profiling the application.
/port:<port>
The port that web applications should be profiled on. (Default: 8013)
/cassini (Alias: /webdev)
Profiling should be performed on the ASP.NET web development server (Cassini).
/cassiniPath:<cassiniPath> (Alias: /cpath)
The location of the ASP.NET project to use with the ASP.NET web development server (Cassini).
/cassiniVirtualDirectory:<cassiniVirtualDirectory> (Alias: /cvd)
The virtual directory to use for the ASP.NET web development server (Cassini).
/cassiniNetVersion:<cassiniNetVersion> (Alias: /cnv)
If Visual Studio 2010 is installed, this is the version of .NET to use when running the web development server (Cassini). Default: 0
/express
Profiling should be performed on the IIS Express webserver.
/expressSitePath alias="epath"
The path where the website can be located on the disk.
/expressConfigPath alias="config"
The path to an "applicationhost.config" file to load.
/expressSiteName alias="site"
The site name to load from an applicationhost.config file. By default the first site found will be used.
/expressNetVersion alias="env"
The version of .NET (2.0 or 4.0) to use when running IIS Express.
/service:<service>
The name of a Windows service to profile.
/complus:<complus>
The name of a COM+ server to profile.
/silverlight:<silverlight>
The URL of a site containing a Silverlight application to profile.
/RecordSqlIo (Alias: /rs)
The profiler should try to record SQL and File I/O events.
/profileSubprocesses (Alias: /sp)
The profiler should profile both the target and any child processes it spawns.
/timeout:<timeout> (Alias: /t)
The number of seconds to wait before terminating the target process. Set to 0 to indicate that no timeout should be used. The default is 120 seconds.
/lineLevel (Alias: /ll)
The profiler should record line-level timings as well as method-level timings.
/methodLevel (Alias: /ml)
The profiler should record only method-level timings (the default).
/onlyWithSource (Alias: /ows)
The profiler should only record values for methods which have source code files specified in their debugging data (pdb) files.
/sampling (Alias: /sm)
The profiler should use sampling to produce approximate results quickly.
/includeSource:<includeSource> (Alias: /is)
Whether or not the results should include the source code. Permitted values are on and off. The default is on.
/inlining:<inlining> (Alias: /in)
Default: on
Whether or not the profiler should allow .NET to inline functions. Turning this off will produce results for more methods, at the expense of a less accurate reflection of the processes performance. Permitted values are on and off. The default is on.
/compensate:<compensate> (Alias: /comp)
Whether or not the profiler should adjust results to account for its own overhead. Permitted values are on and off. The default ison.
/simplify:<simplify> (Alias: /simp)
Whether or not the profiler should simplify certain complicated stack traces to reduce resource requirements. Permitted values are on and off. The default is on.
/avoidTrivial:<avoidTrivial> (Alias: /notriv)
Whether or not the profiler should avoid extremely trivial functions to reduce resource requirements. These functions have a low hit count and a running time of only a few processor cycles. Permitted values are on and off. The default is on.
/aspxPages:<aspxPages> (Alias: /aspx)
Whether or not the profiler should profile the compiled contents of ASPX pages as well as the code that lies behind them. Turning this option on may considerably increase the amount of time the application spends in the JIT. Permitted values are onand off. The default is off.
/threshold:<threshold>
The threshold time in percent that a method must have used in order to be included in the report. Set to 0 to include all results. The default is 0.1.
/csv:<csv>
The name of a file to write a summary of the profiler results as CSV data to.
/xml:<xml>
The name of a file to write a summary of the profiler results as XML data to.
/htmlreport:<htmlreport> (Alias: /h)
The name of a file to write a summary of the profiler results as an HTML report.
/calltree:<calltree>
The name of a file to write a summary of the call tree profiler results as XML data to.
/calltreehtml:<calltreehtml> (Alias: /cth)
The name of a file to write a summary of the call tree profiler results as an HTML report.
/data:<data>
The name of a file to save the profiler results to. The contents of this file can be inspected using the ANTS Performance Profiler desktop application.
Exit Codes
If an error occurs, the following exit codes may be displayed:
0 Success.
1 General error code.
3 Illegal argument duplication. Some arguments may not appear more than once in a command-line. If such arguments appear more than once this exit code will be returned.
8 Unsatisfied argument dependency or violated exclusion when user runs command line.
For example, /arg2 depends on /arg1 but you have specified /arg2 without specifying /arg1, or alternatively /arg2 cannot be used with /arg1 but you have tried to use them both.
32 Value out of range. Numeric value supplied for an argument that is outside the range of valid values for that argument.
33 Value overflow. The magnitude of a value supplied for an argument is too large and causes an overflow.
34 Invalid value. The value supplied for an argument is invalid.
35 No / invalid software license or trial period has expired.
64 General command-line usage error.
65 Data error. Some input data required by the tool is invalid or corrupt.
69 A resource or service required to run the tool is unavailable.
73 Failed to create report
74 IO error occurred. Generally returned if the program attempts to write to a file that already exists without the user having specified the /force option.
77 Action cannot be completed because the user does not have permission.
126 Execution failed because of an error.
130 Execution stopped because Ctrl+Break.
Examples of CSV and XML results files
This section exemplifies the format of the CSV and XML results files that can be saved when profiling from the command line.
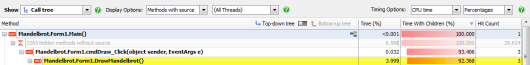
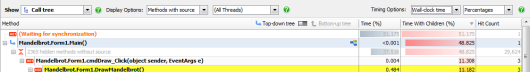
The examples are for the Mandelbrot.Form1.DrawMandelbrot() method. For comparison, the following screenshots show the data for the same method when displayed in the GUI.
With CPU time selected (i.e. excluding time elapsed while a thread was blocked) :
With Wall-clock time selected (i.e. showing total time elapsed, including blocking):
In XML format:
 <Method class="Mandelbrot.Form1" name="DrawMandelbrot" PID="7728" has-source="yes">
   <HitCount>3</HitCount>
   <CPU ticks="3893693658" millisecs="1298.0397" percent="92.3678" />
   <Wallclock ticks="3893772648" millisecs="1298.0660" percent="11.1822" />
   <WithSelf ticks="168573329" millisecs="56.1907" percent-cpu="3.9990" percent-wallclock="0.4841" />
</Method>
In CSV format (with headings row):
(Note that spaces have been added between each field to ensure that the lines in this example wrap.)
Method type, Class, Method, Hit count, CPU %, CPU milliseconds, CPU ticks, Wallclock %, Wallclock milliseconds, Wallclock ticks, CPU % time with self, Wallclock % time with self, Milliseconds with self, Ticks with self
, Mandelbrot.Form1,DrawMandelbrot(), 3, 92.3678149753427, 1298.039706707, 3893693658, 11.1821681679019, 1298.06604003906, 3893772648, 3.99896638783019, 0.484110266291296, 56.1907373464783, 168573329
This documentation contains proprietary information and is protected by copyright law.
Copyright © 2026 Red Gate Software Limited. All rights reserved


