Setting up and running a profiling session
Published 03 December 2012
To profile an application, you must first set up a profiling session. A session specifies:
- The application type, location, and options for the application you want to profile.
- The profiling mode, which determines the level of detail gathered by the profiler while your application is running.
- The method used to calculate timing values (CPU time or wall-clock time).
- The performance counters to display on the timeline.
When you start ANTS Performance Profiler, the ANTS Performance Profiler Settings dialog box is automatically displayed; if ANTS Performance Profiler is already running, click New Profiling Session on the File menu.
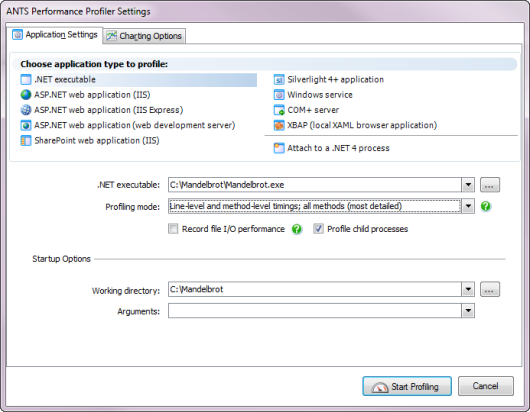
The Application Settings tab displays the settings for the last profiling session you ran. The settings available depend on the selected application type, and may differ from those illustrated above.
The Charting Options tab enables you to choose which performance counter values to display on the timeline for the new profiling session.
To set up and run a profiling session:
- On the ANTS Performance Profiler Settings dialog box, complete the details on the Application Settings tab.
- Choose which performance counters to monitor during profiling using the Charting Options tab.
- Click
 .
.
On Windows Vista, Windows Server 2008, and Windows 7, if you are not running ANTS Performance Profiler as an Elevated administrator, the Start Profiling button has a User Account Control (UAC) shield: . The UAC shield indicates that ANTS Performance Profiler will request elevation when you start profiling.
The timeline is displayed at the top of the main ANTS Performance Profiler window, and the application you want to profile is automatically started. Status text at the bottom-left of the main window indicates what ANTS Performance Profiler is doing during the profiling session.
The timeline starts displaying performance-counter data and events in near-real time. There may be a slight delay between starting a profiling session and seeing the first performance-counter data appear on the timeline. - To display profiling results, do one of the following:
- Drag a region on the timeline.
Profiling data is summarized and displayed for the selected time period only. Your application will continue running and profiling will continue.
- Click
 Stop Profiling.
Your application is closed. Profiling data is summarized and displayed for the entire profiling period. - Close your application.
Profiling data is summarized and displayed for the entire profiling period.
You can continue working with the timeline to locate periods of interest during the execution of your application, and to display the associated profiling results.
- Drag a region on the timeline.
Once you have displayed some profiling data, you can view and analyze it. For more information about the different ways you can do this, see Working with profiling results.
This documentation contains proprietary information and is protected by copyright law.
Copyright © 2026 Red Gate Software Limited. All rights reserved


