Profiling ASP.NET applications running on IIS Express
Published 03 December 2012
IIS Express is a free version of IIS, commonly used in development environments. Like the ASP.NET built-in development server, Cassini, IIS Express can run on development machines without requiring the installation of a full web server, and does not require an administrator account to run. This makes it convenient for testing debug builds of web applications.
You can profile sites running on IIS Express by following the instructions below.
Setting up the Performance Profiler
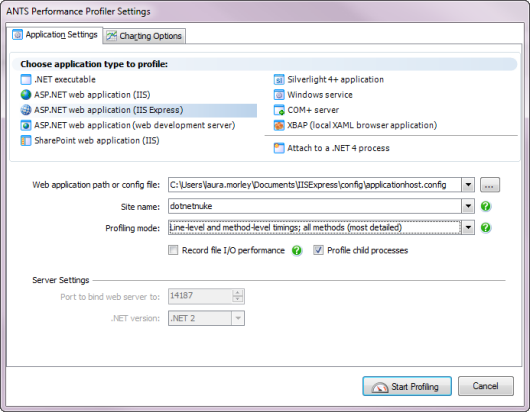
To profile ASP.NET applications running on IIS Express, on the ANTS Performance Profiler Settings dialog box, perform the following steps:
- Under Choose application type to profile, click ASP.NET web application (IIS Express).
- Set the Web application path or config file for the web application that you want to profile.
You can specify the path directly to the web application, or to the site's ApplicationHost.config file. If you select theApplicationHost.config file, a list of available applications configured in that file is displayed: select the application you want to profile. - Select the required Profiling mode, file I/O, and Profile child processes options; see Working with Application Settings.
In ANTS Performance Profiler 7.3 and later, SQL queries and inbound HTTP requests are profiled automatically. - Under Server Settings, set Web server virtual directory to the application's virtual path on the web server.
- In the Port to bind web server to box, set the port on which ANTS Performance Profiler should listen.
For example, if you specify staging for the virtual directory and 8013 for the port number, your web application starts on URL http://localhost:8013/staging/. - Set the .NET version used by your web application.
- If required, change the performance counters to record; see Setting up Charting Options.
- Click
 .
.
IIS Express starts and the web application is shown in Internet Explorer. Note that, although you can interact with the application using any web browser, closing the Internet Explorer instance opened by ANTS Performance Profiler will end your profiling session.
During a profiling session, while your application runs, you can obtain results in the profiler by selecting areas of the timeline.
When you have finished interacting with your web application, click the  Stop Profiling button in ANTS Performance Profiler.
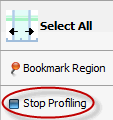
This closes the ASP.NET application. ANTS Performance Profiler shows all of the profiling data collected for the application.
This documentation contains proprietary information and is protected by copyright law.
Copyright © 2026 Red Gate Software Limited. All rights reserved


