Working with Application Settings
Published 03 December 2012
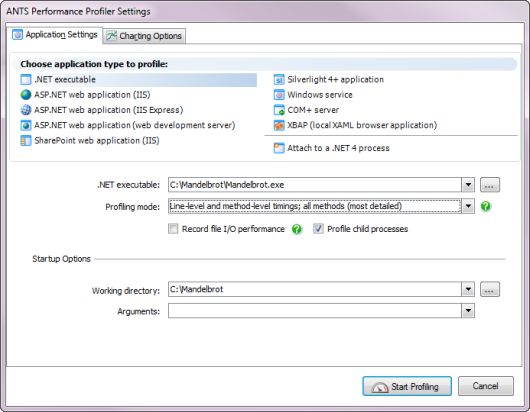
When you set up an application, you specify which application type you want to profile.
This page explains which application type to choose. It also explains settings that are common to all application types: Profiling mode, File I/O (SQL and file I/O in ANTS Performance Profiler 7.0) and Profile child processes.
Other settings are specific to individual application types; to continue setting up your application, follow the appropriate link for your application type.
Application types
Select the application type from the Choose application type to profile list.
- .NET executable
Select this option to profile .NET executables, managed code add-ins, or remotely-hosted XBAP applications.
For additional settings, see Profiling .NET executables, Profiling managed code add-ins, or Profiling XBAP applications. - ASP.NET web application (IIS)
Select this option to profile ASP.NET web applications running on IIS, WCF services running on IIS, or SharePoint.
For additional settings, see Profiling ASP.NET applications running on IIS, Profiling WCF services running on IIS, or Profiling SharePoint.
Web applications are profiled in Microsoft Internet Explorer, even if it is not your preferred browser. This is because ANTS Performance Profiler uses the low-level data exposed by Internet Explorer.
Note that you must profile ASP.NET web applications on the same computer as the one on which IIS is running. - ASP.NET web application (IISE)
Select this option to profile ASP.NET web applications running on IIS Express.
For additional settings, see Profiling ASP.NET applications running on IIS Express.
Web applications are profiled in Microsoft Internet Explorer, even if it is not your preferred browser. This is because ANTS Performance Profiler uses the low-level data exposed by Internet Explorer.
Note that you must profile ASP.NET web applications on the same computer as the one on which IIS is running. - ASP.NET web application (web development server)
Select this option to profile ASP.NET web applications running on the web development server (WebDev, also known as Cassini).
For additional settings, see Profiling ASP.NET applications running on the web development server.
Web applications are profiled in Microsoft Internet Explorer, even if it is not your preferred browser. This is because ANTS Performance Profiler uses the low-level data exposed by Internet Explorer. - SharePoint web application (IIS)
Select this option to profile SharePoint sites and collections running in IIS.
For additional settings, see Profiling SharePoint. - Silverlight 4+ application
Select this option to profile Silverlight 4 and 5 applications.
For additional settings, see Profiling Silverlight 4+ applications.
This feature requires the Silverlight 4 plug-in to be installed in Internet Explorer. - Windows service
Select this option to profile Windows services, or WCF services.
For additional settings, see Profiling Windows services. - COM+ server
Select this option to profile a COM+ server application.
For additional settings, see Profiling COM+ server applications. - XBAP (XAML Browser Application)
Use this option to profile a locally-hosted XBAP application.
For additional settings, see Profiling XBAP applications. - Attach to .NET 4 process
Choose the .NET process you want to attach to.
This feature requires Windows Vista or later and .NET 4.
When you attach to a .NET 4 process, the Sample method-level timings profiling mode is used, SQL and file I/O performance profiling is enabled, and Profile child processes is disabled.
Profiling mode
The Profiling mode determines the level of detail gathered by the profiler while your application is running. The level of detail that you choose may affect the profiling speed and the overall accuracy of the results.
Profiling Mode | Speed | Accuracy | Detail | SQL / HTTP data | Profiling Data |
Line-level and method-level timings; all methods* | * | * * | * * * * | Yes | All methods. This includes methods without source code, such as those in the .NET Framework class libraries. |
Method-level timings; all methods | * * * | * * * | * * | Yes | |
Line-level and method-level timings; only methods with source* | * * | * | * * * | Yes | Only methods for which source code is available, for example, timings will not be measured for .NET Framework methods. |
Method-level timings; only methods with source | * * * * | * * * * | * | Yes | |
Sample method-level timings | * * * * * | * | * | No |
*Profiling data is also collected for individual lines of code.
When you attach to a .NET 4 process, Sample method-level timings are always used.
Record File I/O (ANTS Performance Profiler 7.2 and later)
File I/O profiling is only available in ANTS Performance Profiler Professional edition.
If you have Windows Vista or later, you can record file I/O operations. For more information, see Profiling File IO.
To enable I/O profiling, select Record file I/O performance. Note that enabling this option will make profiling slower.
When you attach to a .NET 4 process, Record file I/O performance is always enabled.
Profile SQL calls (ANTS Performance Profiler 7.2 and later)
SQL call profiling is only available in ANTS Performance Profiler Professional edition.
In ANTS Performance Profiler Professional edition, performance data for SQL calls is automatically recorded in all modes except sampling. SQL call profiling works with all versions of SQL Server including SQL Server Compact, and with Oracle databases, and including calls to databases hosted in the cloud on SQL Services (SQL Azure) and Amazon RDS.
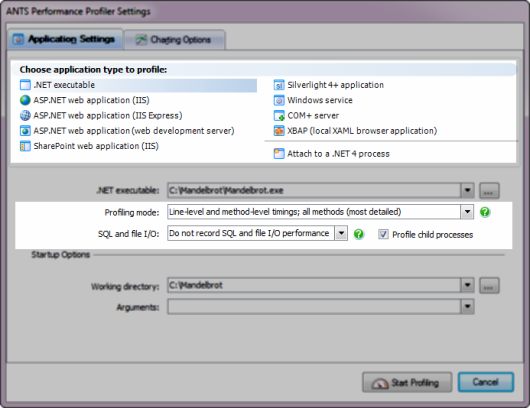
SQL and File I/O (ANTS Performance Profiler 7.0)
SQL and file I/O profiling are only available in ANTS Performance Profiler Professional edition.
If you have Windows Vista or later, you can record file I/O operations. For more information, see Profiling File IO.
If you have Windows Vista or later and a SQL server (except Express editions) installed on the local computer, you can also record SQL queries. For more information, see Profiling SQL queries.
To enable SQL and/or file I/O profiling, select Record SQL and file I/O performance. Note that enabling this option will make profiling slower.
When you attach to a .NET 4 process, Record SQL and file I/O performance is always enabled.
Profile child processes
To simultaneously record performance information from your application and all other processes started by your application, select Profile child processes.
When you attach to a .NET 4 process, Profile child processes is disabled.
This documentation contains proprietary information and is protected by copyright law.
Copyright © 2026 Red Gate Software Limited. All rights reserved


