Profiling Windows services
Published 03 December 2012
A Windows service is a long-running executable that performs specific functions and which is designed not to require user intervention.
To profile a Windows service, it must be installed on the computer on which the profiling will take place. You can install your service using the installutil.exe utility which is supplied with Microsoft Visual Studio.
In ANTS Performance Profiler 7.0
To obtain results with source code, you must use a debug build of your .NET Windows service.
Setting up the performance profiler
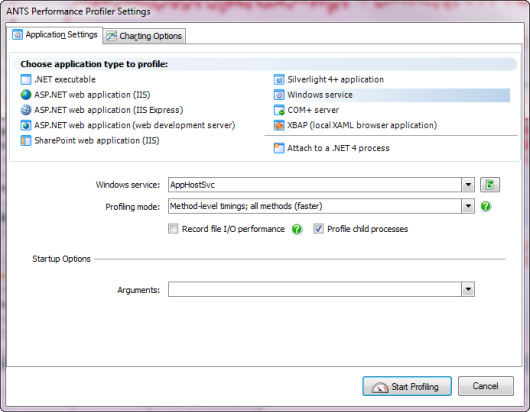
To profile Windows services, on the ANTS Performance Profiler Settings dialog box, perform the following steps:
- Under Choose application type to profile, click Windows service.
- Select your .NET Windows Service from the drop down list. The service here is named Sample Service.
- Select the required Profiling mode, file I/O, and Profile child processes options; see Working with Application Settings.
- If required, specify any Arguments that are to be used when running the service.
- If required, change the performance counters to record; see Setting up Charting Options.
- Click
 .
.
If the service is not already started, ANTS Performance Profiler will start the service.
If the service is already started, ANTS Performance Profiler will restart the service.
During a profiling session you can obtain results by selecting areas of the timeline.
When you have finished profiling the service, click the  Stop Profiling button in ANTS Performance Profiler.
Profiling WCF services
If the service that you want to profile is implemented using the Windows Communication Foundation (WCF), think of the service as a server in a server-client relationship.
Set up ANTS Performance Profiler as described above but after you have clicked , start interacting with the client program to call the service.
The service's communications with the client are included in the results.
This documentation contains proprietary information and is protected by copyright law.
Copyright © 2026 Red Gate Software Limited. All rights reserved


