Profiling SharePoint
Published 03 December 2012
ANTS Performance Profiler can profile managed code that runs on a Microsoft SharePoint 2007 or 2010 server.
To profile SharePoint:
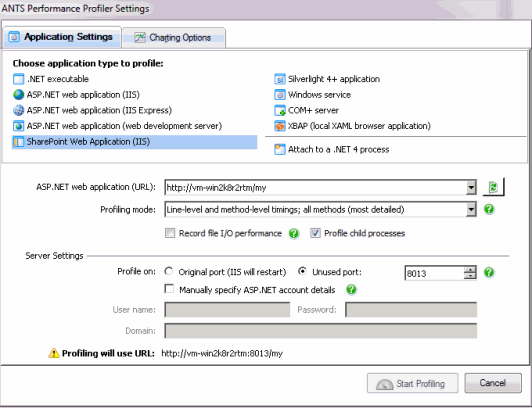
In ANTS Performance Profiler, on the ANTS Performance Profiler Settings dialog box, under Choose application type to profile, click SharePoint web application (IIS).
- Select the ASP.NET web application (URL) for the SharePoint site that you want to profile.
To load a list of currently-running SharePoint sites into the dropdown list, click .
Note that the port specified in this URL is the port where the application usually runs, which is not necessarily the same as the port where the application is to be profiled (see step 4). - Select the required Profiling mode, file I/O, and Profile child processes options; see Working with Application Settings.
- Select the port on which to profile your application:
- If your application does not bind to a specific port, select Unused port and choose a port that is not used by IIS.
- If your application must use the port on which it currently runs, select Original port (IIS will restart).
If IIS does not restart correctly, use IIS Manager to stop the website until you have finished profiling.
The port where the application will be profiled is displayed at the bottom of the ANTS Performance Profiler Settings dialog box. - If required, select Manually specify ASP.NET account details and enter the User name, Password andDomain.
ANTS Performance Profiler profiles your web application as the Windows Local System user. If the Windows Local System user might not have appropriate permissions to use your SharePoint site collection, enter the credentials of a user who does have the required permissions. Note that the user you specify must also be an administrator on the computer on which ANTS Performance Profiler runs. - If required, change the performance counters to record; see Setting up Charting Options.
- Click .
During the profiling session, use your SharePoint site collection as normal. Any additions that you have coded, such as web parts and lists, will be reflected in the ANTS Performance Profiler results if these objects have been accessed. You can interact with the profiler while your site is still running, selecting regions of the timeline to view results.
Calls to sandboxed web parts run in a separate process under partial trust, and cannot be profiled along with the rest of a SharePoint collection. To profile sandboxed web parts, instead profile SPUserCodeV4 and its child processes as a Windows service: for instructions, see Profiling Windows services.
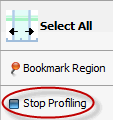
When you have finished interacting with your web application, click the Stop Profiling button in ANTS Performance Profiler.
Note that you can only profile SharePoint site collections running on the computer where the profiler is installed.
Troubleshooting
If you encounter problems while trying to profile a SharePoint application, see Troubleshooting SharePoint profiling.
Troubleshooting in ANTS Performance Profiler 7.0
In ANTS Performance Profiler 7.0, the continuous profiling tool runs as a separate tool from the main ANTS Performance Profiler product. If you installed an early access build of the ANTS Performance Profiler continuous profiler IIS module, other profilers - including the desktop ANTS Performance Profiler product - will be unable to profile applications running in IIS on this computer. To re-enable other profilers with IIS, uninstall the IIS Profiler Module:
- From your computer's Start menu, launch the Continuous Profiling Configuration Tool
- Click Uninstall.
For more information on configuring continuous profiling, see Setting up continuous profiling.


