Setting up continuous profiling
Published 19 August 2013
Continuous Profiling was an experimental feature in ANTS Performance Profiler 7.0 only. It was removed in subsequent versions.
ANTS Performance Profiler includes an early access build of a continuous profiling tool, which lets you collect performance data on running ASP.NET applications hosted in IIS 7 or 7.5.
The tool uses an IIS module to monitor the .NET call stacks in each IIS worker process (w3wp.exe), recording hit counts, timings, and CPU usage data for each method call. Profiling results are displayed in a user interface accessible via a web browser.
Continuous profiling is under active development and ANTS Performance Profiler v7.0 includes an early access version of the functionality. If you have any questions or comments, please visit the Continuous profiling feedback forum.
To enable continuous profiling:
- From your computer's Start menu, launch the Continuous Profiling Configuration Tool.
- Click Install.
The continuous profiling tool installs a profiling module into IIS. The module collects profiling data on all web applications running in IIS.
Results are written to C:\InetPub\ProfilerLogs – in the current early access build, this directory setting cannot be changed. If this directory does not exist, ANTS Performance Profiler creates it. Results are deleted automatically after 6 hours, or when the total size of results files reaches 500MB – whichever is sooner.
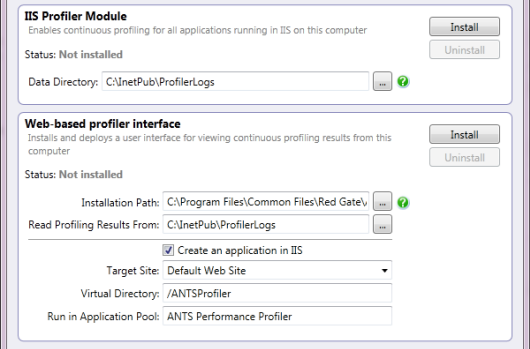
To install and deploy the continuous profiling user interface:
- Choose the Installation Path.
In the current early access build, the Read Profiling Results From path cannot be changed from the default Data Directory, C:\InetPub\ProfilerLogs.
- Select Create site in IIS.
- Choose the Target Site in IIS in which the profiler will create a virtual directory to host the web interface.
This should be a site you have already created in IIS. By default your IIS instance's Default Web Site is used.
- Name the Virtual Directory in which the profiler interface will be created within the target site.
By default the directory is named ANTS Profiler.
If you have a custom IIS configuration, and want to host the web interface at a particular URL, you should first use IIS to create the site in which you want to host the web interface application. Then, in the continuous profiling configuration tool, choose your custom site from the Target Site dropdown and set the Virtual Directory to the path at which you want the web interface to appear.
- Click Install.
By default, ANTS Performance Profiler creates the web interface in its own dedicated application pool, specified in Run in Application Pool.
Viewing continuous profiling results
For information on viewing continuous profiling results in the web interface, see Working with continuous profiling.
Compatibility with other profilers
The continuous profiling tool currently runs as a separate tool from the main ANTS Performance Profiler product. If you have installed an early access build of the ANTS Performance Profiler continuous profiler IIS module, other profilers - including the desktop ANTS Performance Profiler product –- will be unable to profile applications running in IIS on this computer. To re-enable other profilers with IIS, uninstall the IIS Profiler Module:
- From your computer's Start menu, launch the Continuous Profiling Configuration Tool.
- Click Uninstall.
This documentation contains proprietary information and is protected by copyright law.
Copyright © 2026 Red Gate Software Limited. All rights reserved


