ANTS Performance Profiler Options
Published 03 December 2012
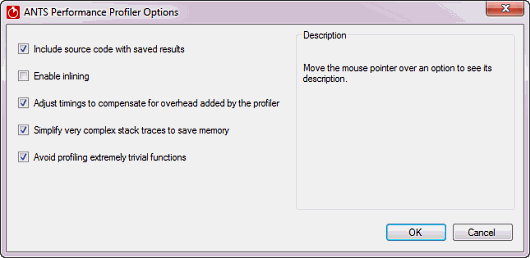
ANTS Performance Profiler includes a number of options that are applied to all profiling sessions. To access these options, on the Tools menu, click Options.
Unless you have a particular need to adjust the options, leave them at their default settings. Changing the default setting for certain options may cause problems during profiling.
Include source code with saved results
Adjust timings to compensate for overhead added by the profiler
Simplify very complex stack traces to save memory
Avoid profiling extremely trivial functions
Include source code with saved results
Includes the contents of source files when you save profiling results. This means that you can review line-level performance data in saved results, without having to restore your source files to their original state.
Note that code generated using integrated decompilation is not saved with results even if this option is selected. For more information, see Working with integrated decompilation.
You may want to clear this option if, for example, you need to distribute performance profiling results for an application that has confidential source code.
By default, this option is selected.
Enable inlining
Enables inlining of methods by the .NET JIT compiler, for the process being profiled.
If you are profiling the release build of an application, selecting this option will produce a profile that is closer to the "real-world" performance. However, the accuracy of the results will be reduced. In particular, line-level timings will be distorted, hit counts will not be recorded for inlined methods, and time spent in inlined methods will be reported as part of the calling method.
By default, this option is not selected.
Adjust timings to compensate for overhead added by the profiler
Adjusts timings by estimating the influence the profiler has had on the process being profiled, and subtracts this from the profiling results. This estimate is most accurate when you use a profiling mode that does not collect line-level timings.
The design of modern processors means that this estimate may not always be accurate, especially for short function calls.
By default, this option is selected.
Simplify very complex stack traces to save memory
Summarizes complex stack traces in profiling results. This conserves resources on the machine you are using for profiling. The stack traces that are summarized are unlikely to be important to your profiling results. However, if you wish to see these summarized results, you can clear this option.
Clearing this option can significantly increase the memory required by the profiler. Depending on the application you are profiling, the profiler may become unstable if you clear this option.
By default, this option is selected.
Avoid profiling extremely trivial functions
Prevents profiling of methods that have a running time measured in tens of nanoseconds, and which contribute to less than one-billionth of the run time in total. Typically, these methods do not produce very relevant performance data. Ignoring these methods reduces the amount of memory required to store and process profiling results.
By default, this option is selected.


