Working with profiling results
Published 03 December 2012
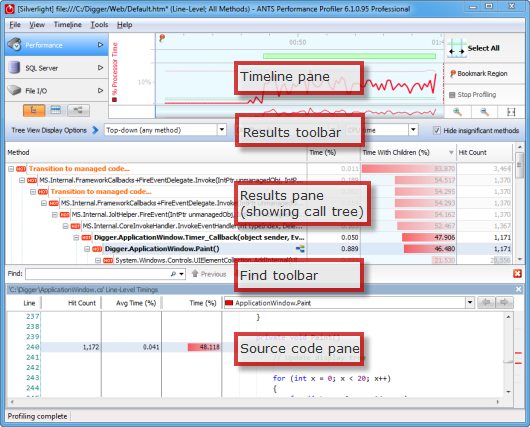
Once you have run a profiling session and displayed some profiling results you can start analyzing the results in the results pane using the three main display types: call tree, methods grid, and call graph.
ANTS Performance Profiler 7.2 and later: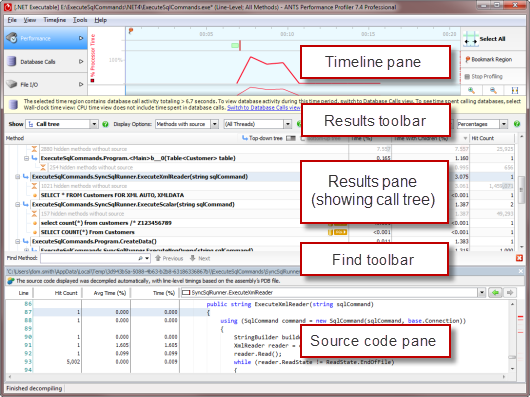
ANTS Performance Profiler 7.0:
Profiling results are shown:
- After you click the
 Stop Profiling button.
 - During profiling, when you select a period on the timeline; see Working with the timeline.
Initially, the profiling results are shown on the call tree. Use the dropdown menu in the results toolbar to switch between display types (or the buttons on the timeline pane in ANTS Performance Profiler 7.0):
| Call tree: shows stack traces that were executed by your application during the time period you have selected. |
| Methods grid: lists each method that was executed by your application during the time period you have selected. |
| Call graph: shows the calling relationships between methods executed by your application, for the time period you have selected. |


This documentation contains proprietary information and is protected by copyright law.
Copyright © 2026 Red Gate Software Limited. All rights reserved


