Working with the methods grid
Published 03 December 2012
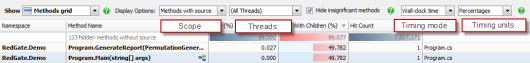
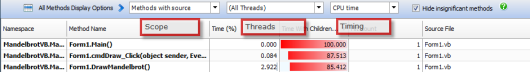
The methods grid lists each method that was called by your application during the time period you have selected. Even if a given method is called in several contexts, it is shown only once in the methods grid, with aggregated data that accounts for all contexts. You can order the data by any column by clicking the column heading. Data is ordered by Time With Children by default.

The following data is shown for each method, for the time period you have selected:
- Time: the total execution time for the method (in all contexts).
- Time With Children: the total execution time for the method and all its children.
- Hit Count: the number of times the method was called.
Methods listed in bold have source code available. To display the method's source code, click any bold method. Line-level timings are also available in the source-code pane if you used the Line-level and method-level timings; all methods or Line-level and method-level timings; only methods with source profiling mode.
Changing the methods-grid display options
You can change the way data is displayed in the methods grid, using the display options on the results toolbar.
Tips on using the methods grid
To find particular methods:
- On the Tools menu, click Find.
The Find bar is displayed beneath the methods grid. - Type all or part of the method name you are looking for.
As you type, the methods are filtered to display only those that match your text.
This documentation contains proprietary information and is protected by copyright law.
Copyright © 2026 Red Gate Software Limited. All rights reserved


