Working with the timeline
Published 03 December 2012
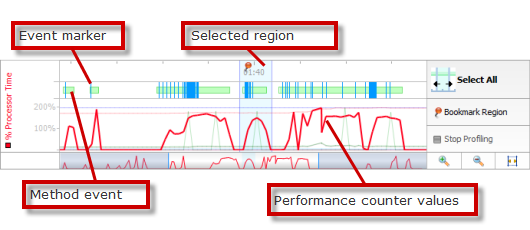
The timeline is visible throughout a profiling session, and provides a frequently updated display of performance-counter values and instances of events related to the application you are profiling. You can use this overview of application activity to isolate performance-profiling results for specific time periods.
The timeline enables you to select a region (corresponding to a time period during execution of your application) for which you wish to display profiling results. You can select and reselect any region as often as you need to, both during profiling and after you have stopped profiling and closed your application. You can also create bookmarks for selected regions, enabling you to define multiple regions and switch between them to look at data for different periods during a profiling session.
The main section of the timeline shows the values for a selection of Windows performance counters. You can choose which performance counters to display before you start profiling your application. See Setting up Charting Options for more information.
The event bar on the timeline shows event markers. These indicate when certain types of event occur within your application, for example, button clicks, window activations, and exceptions. When you move the mouse pointer over an event marker a tooltip provides more information about the event. See Working with event markers and method events for more information.
Working with regions on the timeline
You can select, clear, and bookmark regions on the timeline. Whenever you select a region, profiling results are displayed that relate to the selected period only.
Selecting a region
To select a region, click and drag the mouse pointer  across the timeline. The results pane (beneath the timeline) updates to show profiling results for the selected region.
Resetting a region
To reset the currently selected region to cover the whole timeline, click Select All. The results pane updates to show profiling results for the entire time period for which your application was running.
Bookmarking a region
You can create a bookmark on the timeline, for a selected region. This is useful if there are several periods for which you want to view or compare profiling results: you can easily switch between bookmarked regions to redisplay profiling results.
To bookmark a selected region, click  within the selected region. This region is now bookmarked (this is indicated by a highlighted bar at the top of the timeline). To select this region again later, click within the highlighted bar.
You can name a bookmark to make it easier to identify. To name a bookmark, click the highlighted bar for the bookmark and click  . The name you type will be shown on the bookmark's tooltip.
To delete a bookmark, click the highlighted bar for the bookmark and click  .
.
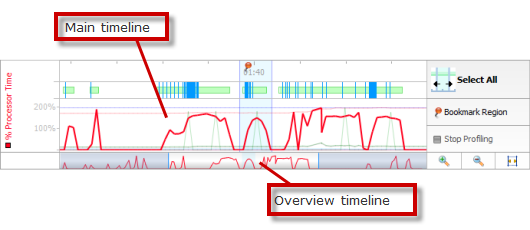
Adjusting the time scale
You can change the time scale to view performance-counter data in more or less detail by rotating the mouse wheel, or by using the zoom-control buttons (zoom in  , zoom out
  , and zoom to fit
  ). You can also use the following keyboard shortcuts: CTRL+PLUS to zoom in; CTRL+MINUS to zoom out.
To pan the main timeline, move the mouse pointer over the highlighted area in the overview timeline ( ), and drag to the left or right.
Working with performance counters
The performance counters available for the current profiling session are listed to the left of the timeline. You can choose which performance counters to display when you set up a new profiling session (see Setting up Charting Options).
To highlight a particular performance counter on the timeline, click its description in the Performance Counters list. Values for the selected performance counter are shown on a tooltip when you move your mouse pointer over the main timeline.
Working with event markers and method events
The events bar (directly above the main timeline) indicates when certain events occurred within the application you are profiling. To display more information about the event, move your mouse pointer over an event marker.
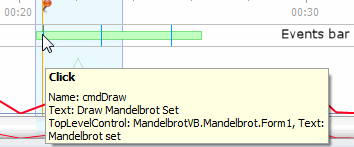
Events are displayed using colored markers:
Event type | Color |
Exception |
|
Click |
|
Window activated and window closed |
|
All other events |
|


To see which method threw a given exception, click on the exception marker: the method will be selected in the call tree or method grid below, and its source, if available, displayed in the source code view. (ANTS Performance Profiler 7.3 and later).
If you click on a method in the call tree or on the methods grid (and when you display the call graph for a method), the times when that method executed are shown as light green areas in the events bar. These areas are called 'method events'. If the method called unmanaged code, the period when the unmanaged code ran is shown as dark green.
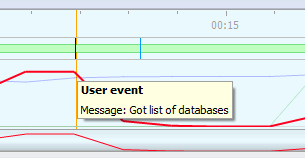
Adding custom event markers
It is possible to add your own event markers to the timeline. For example, you might want to know when a certain item is loaded into memory or when an ASP.NET page is loaded or unloaded. To add a custom marker:
- Copy %ProgramFles%/Red Gate/ANTS Performance Profiler 7/RedGate.Profiler.UserEvents.dll to your application's bin folder. (Create the bin folder using Windows Explorer if it does not already exist.)
- Reference the DLL from your application.
Add the following line to your application wherever you want to see an event marker on the profiler's timeline. (Replace 'The message' with a short description of the event.)
RedGate.Profiler.UserEvents.ProfilerEvent.SignalEvent("The message");- When you profile your application, the event is shown in the ANTS Performance Profiler timeline with a black event marker. Move your mouse over the event marker to display the message.
Note that you cannot use custom event markers when profiling Silverlight applications.
This documentation contains proprietary information and is protected by copyright law.
Copyright © 2026 Red Gate Software Limited. All rights reserved


