Working with the call tree
Published 03 December 2012
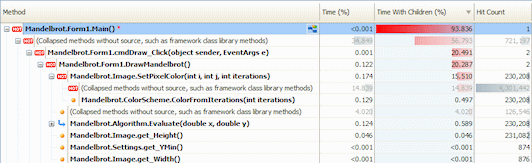
The call tree shows the stack traces that were executed by your application during the time period you have selected. By default, stack traces are displayed top-down (calling method above called method). The "hottest" stack trace (the one that took the most time to run) is displayed at the top of the call tree, and is automatically expanded. If a method was called in several contexts, it is displayed once for each context in the call tree.
See Tips on using the call tree for more information on how to use the call tree effectively.
Reading the call tree
The following data is shown for each method within the stack trace, for the selected time period:
- Time: the total execution time for the method within this stack trace.
- Time With Children: the total execution time for the method and all its children within this stack trace.
- Hit Count: the number of times the call was made within this stack trace.
When time is shown as a percentage, the Time (%) for each method shows the proportion of the total execution time that the method contributed during the selected period. The total percentage for all methods can sum to over 100 on machines using multiple CPU cores.
SQL calls (ANTS Performance Profiler 7.2 and later)
In ANTS Performance Profiler Professional edition, SQL calls made by the application are also shown within the stack trace, with the following information:
- Time: The time until the first result for the query was returned.
- Time With Children: The total execution time for the call and all its children within this stack trace.
- Hit Count: The number of times the query was called within this stack trace.
HTTP calls (ANTS Performance Profiler 7.3 and later)
In ANTS Performance Profiler Professional edition, if your application is an ASP.NET site, you will also see incoming HTTP requests in the call tree, with the following information:
- Time: The time taken to execute the .NET helper method(s) that ran the request.
- Time With Children: The total execution time for the request and all the .NET methods executed because it was made.
- Hit Count: The number of times the request was called within this stack trace.
To collapse all nodes except HTTP requests, right-click anywhere in the call tree and select Show only incoming HTTP calls. SQL calls will also be shown.
Call tree icons
Each tree item is shown with one or more of the following icons:
| Root method or leaf method. Root methods are not called by any other method; leaf methods do not call any other method. |
| Indicates call flow when the call tree direction is top-down (calling method above called method). |
| Indicates call flow when the call tree direction is bottom-up (called method above calling method). |
| Indicates one or more collapsed methods that can be expanded. |
| Indicates one or more collapsed methods that cannot be expanded, because they are all leaf nodes that have been filtered out of the current view - see Filtering the call tree. |
| Method is part of the hottest (longest running) stack trace. Used instead of the root/leaf or call-flow icons. |
| * | A method name followed by an orange asterisk: Method is optimizable. (ANTS Performance Profiler 7.2 and earlier) |
| Indicates a SQL call generated by the parent .NET method. |
| Indicates an HTTP request: the .NET methods listed as children of this item were called when this HTTP request was made. (ANTS Performance Profiler 7.3 and later) |


Methods listed in bold have source code available. To display the method's source code, click any bold method. Line-level timings are also available in the source-code pane if you use one of the Line-level ... profiling modes.
You may also see the following items in the call tree. These are shown in bold orange text, and represent time spent in your application that is in addition to time spent executing specific methods:
- Waiting for synchronization: A thread was waiting. For example, if you have called the
Monitor.Waitmethod, the thread will wait for synchronization until the lock is reacquired. Another cause is that the finalizer thread spends most of its time waiting. Expand the call graph to see what caused the wait. Items that are Waiting for synchronization only contribute to timings in the call tree when the Timing display option is set to Wall-clock time. To exclude time due to Waiting for synchronization items, select CPU time from the Timing display option. - Thread blocked: The executing thread was blocked. For example, the thread may have been sleeping, or waiting for access to a shared resource. Thread blocked items only contribute to timings in the call tree when the Timing display option is set to Wall-clock time. To exclude time due to Thread blocked items, select CPU time from the Timing display option. The call-tree display options are described below.
- Waiting for I/O to complete: The executing thread was blocked waiting for file I/O. Waiting for I/O to complete items only contribute to timings in the call tree when the Timing display option is set to Wall-clock time. To exclude time due toWaiting for I/O to complete items, select CPU time from the Timing display option. The call-tree display options are described below.
- Transition to unmanaged code: A transition from managed code to unmanaged code occurred at this point in the stack trace. In general, line-level and method-level timings are not available for the unmanaged code. However, for unmanaged methods that are declared with
externwithin managed code, method-level timings are available. - Transition to managed code: A transition from unmanaged code to managed code occurred at this point in the stack trace.
- JIT overhead: JIT compilation occurred at this point in the stack trace during execution of your application. The method that needed to perform the compilation is shown as the parent of a JIT overhead item.
- Profiler overhead: Additional overhead introduced by ANTS Performance Profiler. This is unlikely to be seen when the option to adjust timings to compensate for overhead added by the profiler is enabled.
- Assembly load or unload: A .NET assembly was loaded or unloaded.
- Module load or unload: A .NET module was loaded or unloaded.
To create a new call graph based on a particular method, select the method in the call tree, and click the new call graph button  in the Method column.
To switch to view a SQL query in Database Calls view, select the method in the call tree, and click the ![]() button in the Method column. (ANTS Performance Profiler 7.2 and later)
button in the Method column. (ANTS Performance Profiler 7.2 and later)
This documentation contains proprietary information and is protected by copyright law.
Copyright © 2026 Red Gate Software Limited. All rights reserved


