Working with the call graph
Published 03 December 2012
The call graph shows the calling relationships between methods during the execution of your application, and is focused on a method of your choice (the chosen method; shown in black in the example below). If a given method is called in several contexts, it is shown once for each context in the call graph. The chosen method is shown only once in the call graph, unless it is called recursively.
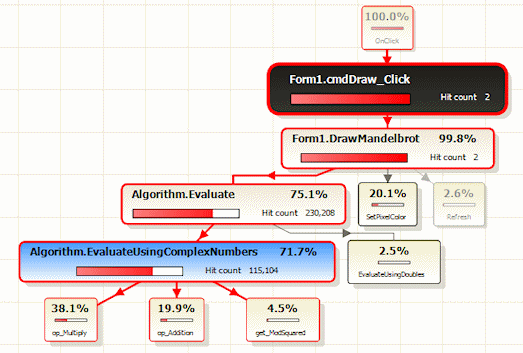
Selecting a chosen method makes it easy for you to visualize all the callers and callees for that method.
The percentage value shown in each method is calculated with respect to the chosen method as follows:
- For a method called by the chosen method, this is the percentage of the chosen method's execution time that the method accounts for, relative to the chosen method's total execution time.
- For a method that calls the chosen method, this is the percentage of the chosen method's total execution time that is due to the calling method.
Calculations are always made with respect to the selected region on the timeline, or the whole profiling period if you have not selected a region.
Creating a new call graph
Every instance of a call graph is based on a particular method, so you must first select a method in the call tree, methods grid, or source code, then click the create new call graph button  :
:
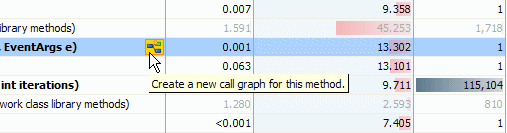
Alternatively, right-click the method and select Create new call graph on the short-cut menu.
The call graph is displayed in the results pane.
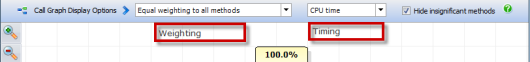
Changing the call-graph display options
You can change the way data is displayed in the call graph, using the display options on the results toolbar:

Navigating the call graph
You can resize the call graph by rotating the mouse wheel, or by using the zoom controls to the left of the call graph. You can pan the call graph by clicking and dragging on a blank part of the graph.
To expand a method on the call graph (that is, to show the method's immediate children or parents), click the method.
To expand the most expensive path from a particular method, hold down the CTRL key and click the method. Alternatively, right-click and select Expand most expensive stack trace.
To expand the most expensive path for all children from a particular method, hold down the SHIFT key and click the method. Alternatively, right-click and select Expand most expensive stack trace for all callees.
To expand the most expensive path for all parents of a particular method, hold down the SHIFT key and click the method. Alternatively, right-click and select Expand most expensive stack trace through all callers.
To collapse a method on the call graph, double-click the method.
More about call graphs
Methods are drawn in several different styles in a call graph:
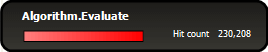
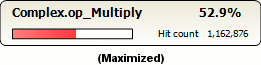
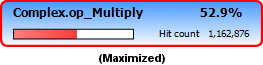
| Chosen method (the method you chose when creating the call graph). Execution-time percentages are calculated with respect to this method. |
| Method with source code. |
| Method without source code. This style is used when all methods have equal weighting. |
| Method without source code. This style is used when methods with source code are emphasized. |
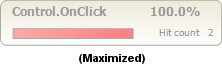
| Selected method. When a method is selected,all methods in that stack trace are also outlined in red. |
| Recursive method. The |


Call graphs always include methods for which no source code is available (for example, methods from the .NET Framework class library) and methods for all threads running in your application during profiling.
It is not possible to change the time period covered by an existing call graph. To create a call graph for a different time period, return to the call-tree or methods-grid display, reselect the required period on the timeline, and create a new call graph.
This documentation contains proprietary information and is protected by copyright law.
Copyright © 2026 Red Gate Software Limited. All rights reserved


