Working with the database calls view
Published 03 December 2012
In ANTS Performance Profiler Professional, the Database Calls view shows performance data for all the database calls your application made during the time period you have selected.
If a call was made multiple times, it is still shown only once in the database calls view, with timing and hit count data aggregated from each instance of the call.
Note that database call performance data is not recorded when profiling in sampling mode.
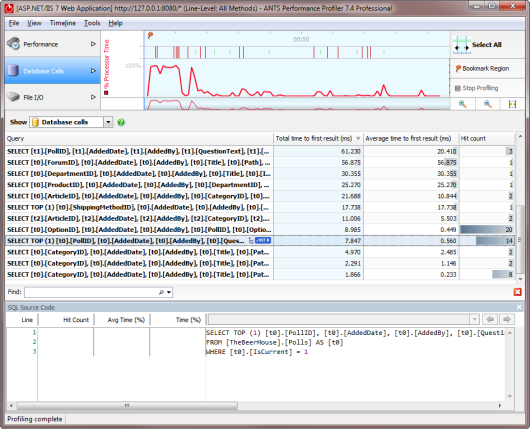
The following data is shown for each database call, for the time period you have selected:
- Query: The first line of the database query (excluding any initial blank lines). To view the full query text, move the mouse over the row.
- Total time to first result (ms): The time taken (in milliseconds) until the query returned its first result.
Where a call was made multiple times, Total time to first result shows the sum of the time to return a first result taken by all instances of the call. - Average time to first result (ms): The time taken (in milliseconds) until the query returned its first result. (ANTS Performance Profiler 7.4 only)
Where a call was made multiple times, Average time to first result shows the average time taken for each instance of the call to return the first result. - Hit count: The number of times the call was made.
When a query is selected, a green highlight on the timeline shows the period when the call was running. Source code for the selected query is shown below the list of queries, in SQL Source View.
Linking back to your code
To find out which of your code's methods ran a particular SQL query:
- In Database Calls view, select the query.
A
 icon appears on the right-hand side of the Query column.
 - Click on the icon.
The display switches to Performance view, displaying the call tree, with the SQL query selected.
You can scroll up the call tree to locate the query's .NET parent, and browse its timings to determine whether the problem lies in the way the query is called.
For more information on understanding .NET method timings, see Working with the call tree.
- In Database Calls view, select the time when the query ran on the timeline. Include some time just before the SQL query ran, and the server load increased: this will ensure your selected range includes the time when the method that runs the query was called.
- Switch back to Performance view.
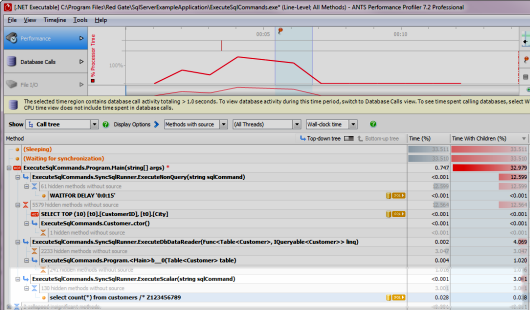
- When the call tree is displayed, the selected SQL query is shown as a child of the .NET method that originated it.
Browse the timings for the parent .NET code to determine whether the problem lies in the way the query is called.
This documentation contains proprietary information and is protected by copyright law.
Copyright © 2026 Red Gate Software Limited. All rights reserved


