Working with continuous profiling
Published 19 August 2013
Continuous Profiling was an experimental feature in ANTS Performance Profiler 7.0 only. It was removed in subsequent versions.
For instructions on installing and setting up continuous profiling, see Setting up continuous profiling.
Continuous profiling is under active development and ANTS Performance Profiler v7.0 includes an early access version of the functionality. If you have any questions or comments, please visit the Continuous Profiling feedback forum.
To view continuous profiling results:
- Launch the profiling results web interface in Chrome, Firefox, or Internet Explorer 9.
By default the interface is located at http://localhost/ANTSProfiler. If you specified another target site during installation, the interface will be located at that address instead.
The web interface displays method calls made in all sites running in IIS, except in the application pool where the profiler interface is hosted.
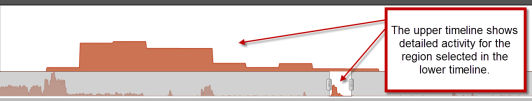
The interface displays two timelines: the lower timeline shows CPU usage for up to the last six hours (a shorter interval is shown if 500MB of results were generated in under six hours). To view detailed CPU usage information in the upper timeline, select a region on the lower timeline.
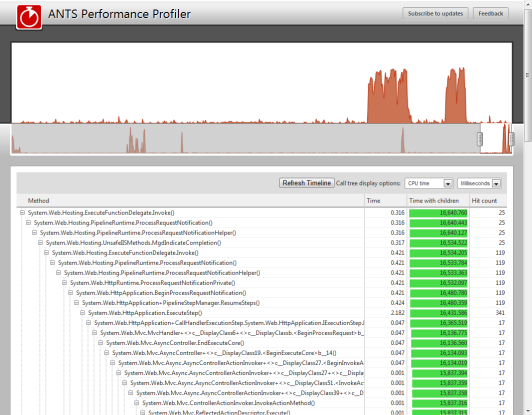
When you select a region, a call tree appears below the timelines, showing all methods called during the selected interval. Use the  and
and  buttons to expand and collapse the call stacks.
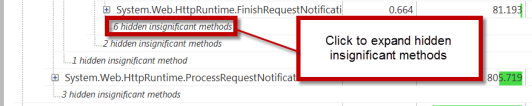
Insignificant methods, with an execution time totaling less than 1% of the parent method's execution time, are hidden in the call tree and indicated with the message "hidden insignificant methods". To display these methods, click "[x] hidden insignificant methods".
For advice on interpreting results, see Working with the call tree.
Compatibility with other profilers
The continuous profiling tool currently runs as a separate tool from the main ANTS Performance Profiler product. If you have installed an early access build of the ANTS Performance Profiler continuous profiler IIS module, other profilers - including the desktop ANTS Performance Profiler product –- will be unable to profile applications running in IIS on this computer. To re-enable other profilers with IIS, uninstall the IIS Profiler Module:
- From your computer's Start menu, launch the Continuous Profiling Configuration Tool.
- Click Uninstall.
This documentation contains proprietary information and is protected by copyright law.
Copyright © 2026 Red Gate Software Limited. All rights reserved


