Profiling managed code add-ins
Published 03 December 2012
Microsoft Visual Studio, Microsoft Word, Microsoft Excel and Microsoft SQL Server Management Studio are all examples of desktop applications which host the .NET Common Language Runtime. You can create .NET add-ins for these programs.
The procedure for using ANTS Performance Profiler to profile a native desktop application that hosts the .NET runtime is similar to that for profiling other .NET applications.
This page uses a SQL Server Management Studio add-in as an example. SQL Server Management Studio is a native application which hosts the CLR which, in turn, allows it to execute managed code. If you are profiling an add-in for a different program (Word or Excel, for example), you must use that program instead of SQL Server Management Studio in all of the following instructions.
Setting up the performance profiler
To profile managed code add-ins, on the ANTS Performance Profiler Settings dialog box, perform the following steps:
- Under Choose application type to profile, click .NET executable.
- Browse to the .NET executable that you want to profile.
Note: this is the native application that contains your add-in; for example, SQL Server Management Studio.
Use the dropdown list to select a recently-profiled application. - Select the required Profiling mode, file I/O, and Profile child processes options; see Working with Application Settings.
- If required, change the Working directory.
The working directory is the path where the application will start. By default, this is the directory where the native application is located.
Use the dropdown list to select a recently-used working directory. - If required, specify any command line Arguments that are to be used when running the application.
- If required, change the performance counters to record; see Setting up Charting Options.
- Click .
SQL Server Management Studio starts. Connect to a server and interact with your add-in.
During a profiling session you can interact with the profiler while your application is still being profiled, and obtain results by selecting areas of the timeline.
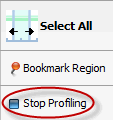
When you have finished interacting with your web application, click the Stop Profiling button in ANTS Performance Profiler.
Other applications
The same approach will work with all other hosting applications. For example, to profile a Visual Studio .NET add-in, enter the full path to devenv.exe as the .NET application that you want to profile.
You can also profile a managed code Microsoft Management Console (MMC) snap-in in the same way; select mmc.exe as the .NET executable, add the snap-in, then interact with it.


