Profiling File IO
Published 03 December 2012
You can use ANTS Performance Profiler Professional to profile when the application that you are profiling reads from discs or writes to discs (including network drives).
Note that you can only profile File I/O on Windows Vista or later, or Microsoft Server 2008.
Setting up File I/O profiling
Before profiling File I/O, we recommend that you check for performance issues in your code (and any third-party code).
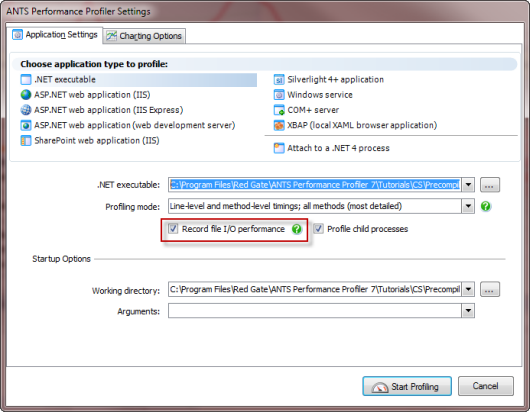
To enable File I/O profiling, set up the profiler in the same way that you would configure the settings for performance profiling. Ensure that Record file I/O performance is selected (in ANTS Performance Profiler 7.0, that SQL and file I/O is set to Record SQL and file I/O performance).
While profiling in Performance view, set the Tree View Display Options to show Wall-clock time, because CPU time does not include time spent blocked waiting for File I/O. When you have identified a slow line of code, which involves a reading from or writing to a disc, profile File I/O.
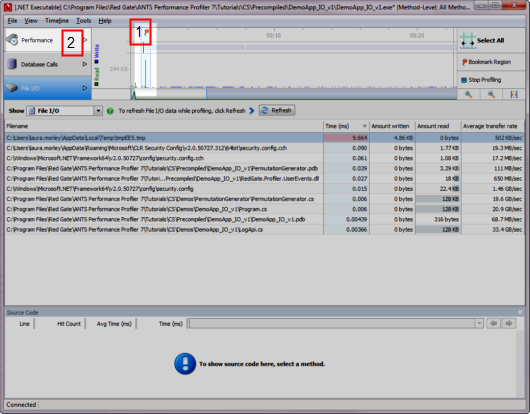
Viewing File I/O results while profiling
- Drag to select the portion of the timeline that you are interested in.
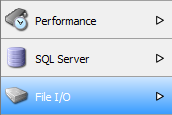
- Click File I/O.
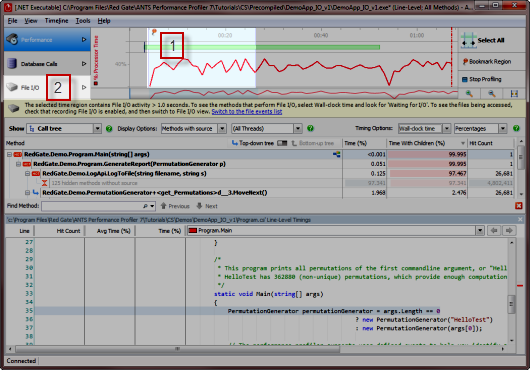
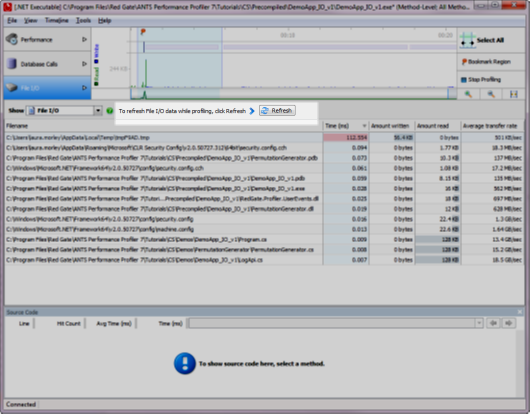
- Note that the timeline is not automatically updated while profiling File I/O. To display queries performed since you switched to File I/O view, click Refresh.
Viewing File I/O results after profiling
If profiling is not currently in progress, click File I/O.
Linking back to your code
To find which of your code's methods caused File I/O to occur:
- Select the time when the I/O occurred on the timeline. Include some time just before the I/O because the method which caused the I/O will be called before the I/O takes place.
- Switch back to Performance view.
- Under Tree View Display Options, select Methods with source.
- In the tree view, the method which caused the File I/O should be found near the highlighted method.
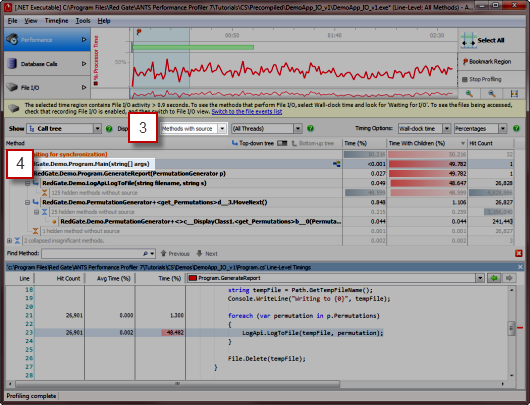
Use the line-level timings to look for code that could be optimized.
This documentation contains proprietary information and is protected by copyright law.
Copyright © 2026 Red Gate Software Limited. All rights reserved


