Profiling ASP.NET applications running on the web development server
Published 03 December 2012
The ASP.NET web development server (also known as 'WebDev' or 'Cassini') is the built-in web server for your development environment. It is a good place to start debugging web applications because, unlike in IIS, you do not have to worry about configuration and security settings. You also do not have to worry about stopping and restarting the web server. The web development server does have limitations, however, so eventually you will want to test your web application under IIS. This is especially true if your web application has pages accessible only by users with the appropriate security settings.
You can profile a debug build of your ASP.NET web application while it runs in the web development server by following the instructions below.
Setting up the Performance Profiler
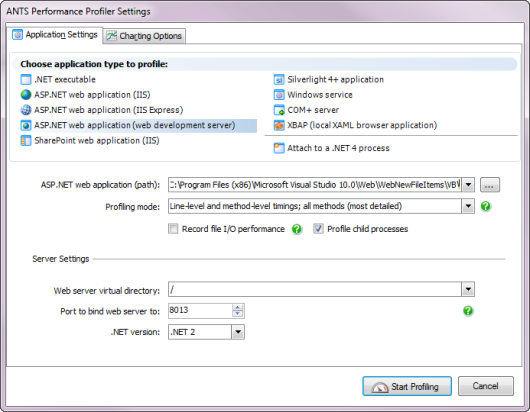
To profile ASP.NET applications running on web development server, on the ANTS Performance Profiler Settings dialog box, perform the following steps:
- Under Choose application type to profile, click ASP.NET web application (web development server).
Set the ASP.NET web application (path) for the web application that you want to profile.
The path is where the file with the file extension .aspx is located.
Note: You may find that the .aspx file is saved in the /WebSites/ directory, not in the /Projects/ directory where you would normally expect to find it.ANTS Performance Profiler 7.3 and later
For MVC3 applications that do not have a .aspx file, enter the path to the folder containing the highest-level Web.config file for the application.
- Select the required Profiling mode, file I/O, and Profile child processes options; see Working with Application Settings.
In ANTS Performance Profiler 7.3 and later, SQL queries and inbound HTTP requests are profiled automatically. - Under Server Settings, set Web server virtual directory to the application's virtual path on the web server.
- In the Port to bind web server to box, set the port on which ANTS Performance Profiler should listen.
For example, if you specify staging for the virtual directory and 8013 for the port number, your web application starts on URL http://localhost:8013/staging/. - Set the .NET version used by your web application.
- If required, change the performance counters to record; see Setting up Charting Options.
- Click
 .
.
The web development server starts and the web application is shown in Internet Explorer. Note that, although you can interact with the application using any web browser, closing the Internet Explorer instance opened by ANTS Performance Profiler will end your profiling session.
During a profiling session, while your application runs, you can obtain results in the profiler by selecting areas of the timeline.
When you have finished interacting with your web application, click the  Stop Profiling button in ANTS Performance Profiler.
This closes both the web development server and the ASP.NET application. ANTS Performance Profiler shows all of the profiling data collected for the application.
This documentation contains proprietary information and is protected by copyright law.
Copyright © 2026 Red Gate Software Limited. All rights reserved


