Profiling Silverlight applications
Published 03 December 2012
You can use ANTS Performance Profiler to profile Silverlight 4 and 5 applications.
Note that line-level timings are not available when profiling Silverlight applications, and that some performance counters are not shown on the timeline.
Introducing Silverlight applications
Microsoft Silverlight applications can run either in a web browser, or in an Out-Of-Browser mode, depending on the setting chosen at compile-time.
Silverlight applications that run in a web browser are contained in an HTML or ASPX file which may be stored:
- in the local file system.
- on an HTTP server on the local computer.
- on an HTTP server on a remote computer.
Setting up the Performance Profiler (Silverlight applications running in a web browser)
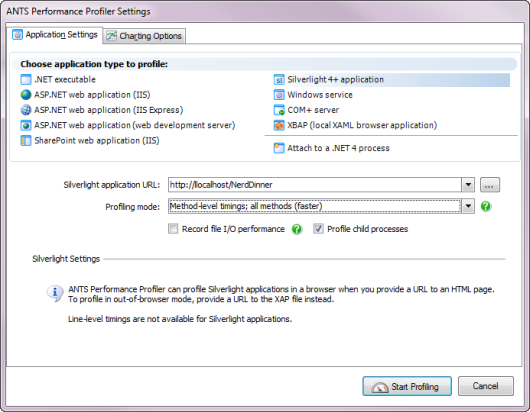
To profile Silverlight browser applications running in a web browser, on the ANTS Performance Profiler Settings dialog box, perform the following steps:
- Close all instances of Internet Explorer that are currently running on your computer.
This ensures that ANTS Performance Profiler connects to the correct instance of iexplore.exe when you start profiling.
- Under Choose application type to profile, click Silverlight 4+ browser application.
- For the Silverlight application URL, enter either the local file path (prefixed by file:///) to the HTML file that embeds the Silverlight application, or the URL of the HTML or ASPX file that embeds the application.
Note that the URL must be a server running on the same computer as the computer where ANTS Performance Profiler is installed. - Select the required Profiling mode, file I/O, and Profile child processes options; see Working with Application Settings.
Note that line-level timings are not available for Silverlight applications. - If required, change the performance counters to record; see Setting up Charting Options.
- Click
 .
.
Microsoft Internet Explorer launches, and the Silverlight application is shown.
During a profiling session you can interact with the profiler while your application is still being profiled, and obtain results by selecting areas of the timeline.
When you have finished interacting with your web application, click the  Stop Profiling button in ANTS Performance Profiler.
Setting up the Performance Profiler (Silverlight applications running in Out-Of-Browser mode)
To profile Silverlight 4 or 5 browser applications running in Out-Of-Browser mode, on the ANTS Performance Profiler Settings dialog box, perform the following steps:
- Under Choose application type to profile, click Silverlight 4+ browser application.
- For the Silverlight application URL, enter the local file path (prefixed by file:///) to the XAP file.
This is normally found in %LOCALAPPDATA%\Microsoft\Silverlight\OutOfBrowser\. - Select the required Profiling mode, file I/O, and Profile child processes options; see Working with Application Settings.
Note that line-level timings are not available for Silverlight applications. - If required, change the performance counters to record; see Setting up Charting Options.
- Click .
The Microsoft Silverlight Out-Of-Browser launcher starts, and the Silverlight application is shown.
During a profiling session you can interact with the profiler while your application is still being profiled, and obtain results by selecting areas of the timeline.
When you have finished interacting with your web application, click the Stop Profiling button in ANTS Performance Profiler.
Troubleshooting
If you experience problems:
- Ensure that the Silverlight application is compiled against Silverlight 4 or 5. Older versions of Silverlight may appear to work but will give inaccurate results.
- Check that the Silverlight application runs correctly on the computer which you are profiling it on, without the profiler attached.
- Note that you may need to run ANTS Performance Profiler as an Administrator for some types of Silverlight application and computer configuration.
This documentation contains proprietary information and is protected by copyright law.
Copyright © 2026 Red Gate Software Limited. All rights reserved


