Profiling SQL queries in ANTS Performance Profiler 7.0
Published 19 August 2013
You can use ANTS Performance Profiler Professional to profile database queries sent by an application to a Microsoft SQL server instance.
You might want to profile SQL queries if performance timings have revealed that a line of code involving a database query is particularly slow.
Note that:
- profiling SQL queries is not possible with SQL Server Express: Because SQL Server Express does not expose performance counters, ANTS Performance Profiler cannot obtain results.
- the SQL Server instance must be on the same computer that the profiler is running on.
- you can only profile SQL queries on Windows Vista or later, or Microsoft Server 2008.
Viewing SQL profiling results
Before profiling SQL, we recommend that you check for performance issues in your code (and any third-party code). Profile SQL when you have identified a slow line of code that involves a SQL query.
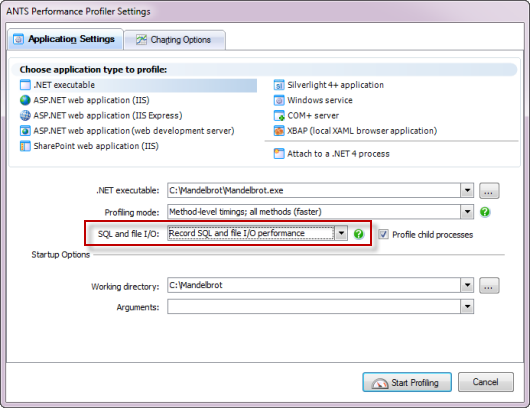
Set up a new profiling session using the Application Settings dialog.
Ensure that SQL and file I/O: is set to Record SQL and file I/O performance.
Viewing SQL results while profiling
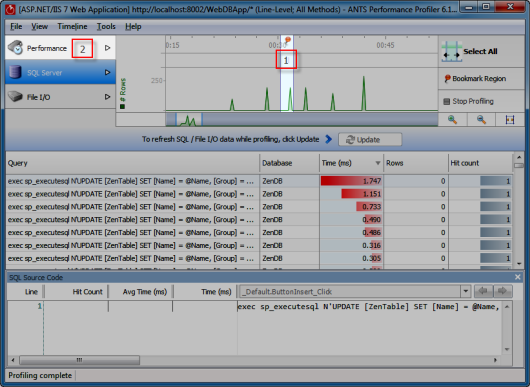
- Drag to select the portion of the timeline that you are interested in.
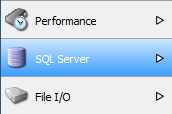
- Click SQL Server.
- Note that the timeline is not automatically updated while profiling SQL queries. To display queries performed since you switched to SQL Server view, click Update.
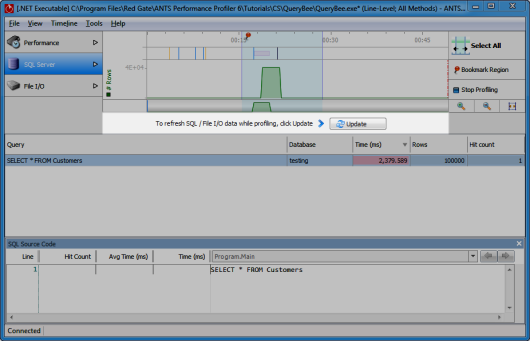
- The timeline and the Query panel update to show the latest data.
Viewing SQL results after profiling
If profiling is not currently in progress, click SQL Server.
SQL results for the entire complete profiling session are displayed on the timeline.
Tips
Long-length queries
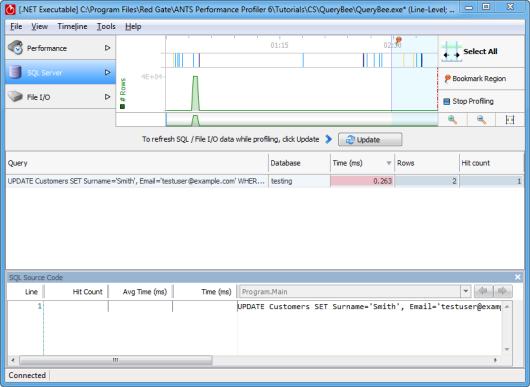
If the SQL query is a multi-line query, or is just very long, it may be truncated in the Query list. To display the full query, select it. The query is shown in the scrollable SQL Source Code panel.
Note that the Hit Count, Avg Time and Time columns are empty in the SQL Source Code panel, because line-level timings are unavailable for SQL Server. See the Hit Count and Time columns in the Query list to view the time taken by the entire query.
Linking back to your code
To find out which of your code's methods ran a particular SQL query:
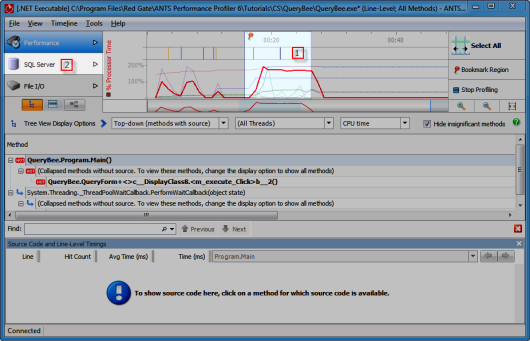
- Select the time when the query ran on the timeline. Include some time just before the SQL query ran, and the server load increased: this will ensure your selected range includes the time when the method that runs the query was called.
- Switch back to Performance view.
- Under Tree View Display Options, select Top-down (methods with source).
- In the tree view, the method that ran the SQL query should be found near the highlighted method.
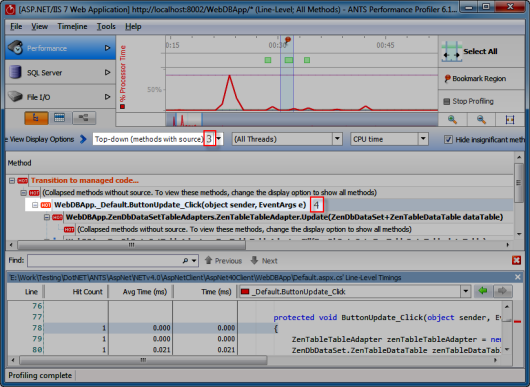
- Browse the line-level timings to find code that could be optimized.
This documentation contains proprietary information and is protected by copyright law.
Copyright © 2026 Red Gate Software Limited. All rights reserved


