Worked example - Profiling network overheads
Published 11 June 2013
This worked example demonstrates how to use ANTS Performance Profiler to profile a .NET executable that exhibits latency problems caused by fetching HTTP data from a network.
Introducing LatencyDemo
This worked example uses LatencyDemo.
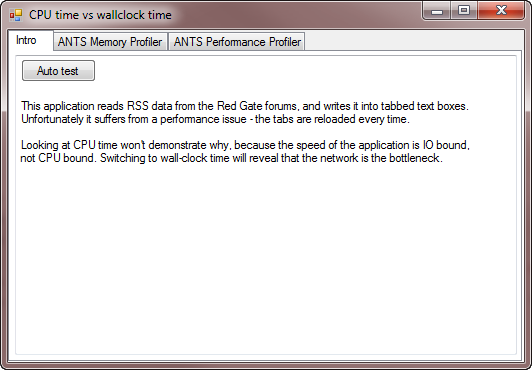
LatencyDemo is a simple Windows application that fetches the RSS feeds from the ANTS Memory Profiler and ANTS Performance Profiler forums on the Redgate website.
A copy of LatencyDemo is supplied with ANTS Performance Profiler in %Program Files%\Red Gate\ANTS Performance Profiler 8\Tutorials\CS\Precompiled\LatencyDemo\
Walkthrough
- Start ANTS Performance Profiler
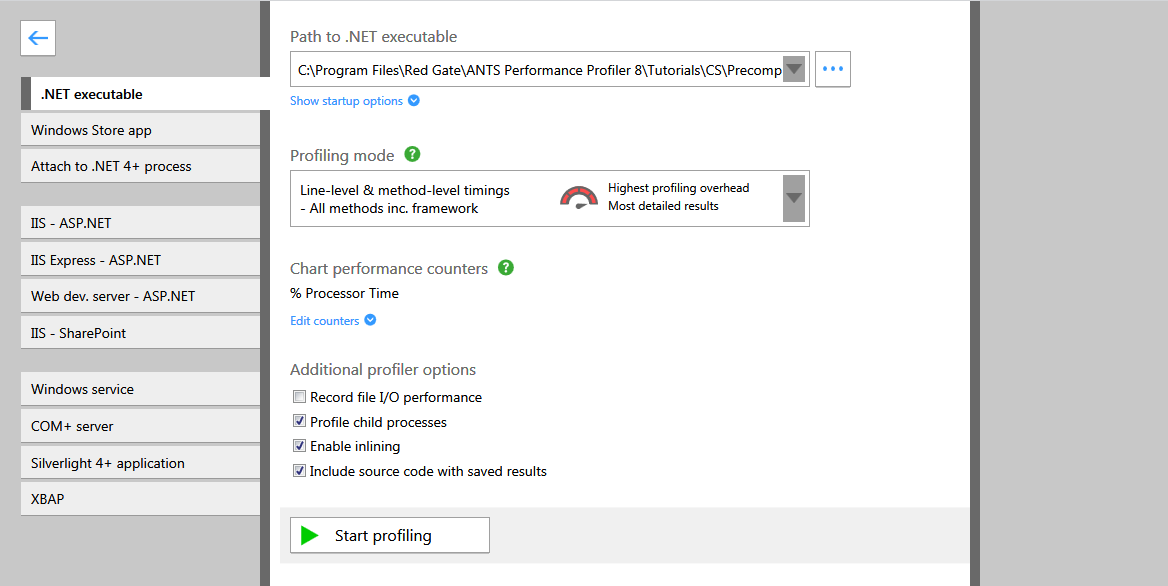
- Select .NET executable
- Enter the path to the demo application LatencyDemo.exe
- Click Start Profiling
- If required by your configuration, grant elevation permission
- The demo application starts
- Load the ANTS Memory Profiler RSS feed by clicking ANTS Memory Profiler
- Load the ANTS Performance Profiler RSS feed by clicking ANTS Performance Profiler
- Click Intro
- Click Auto test. Focus switches between the tabs 20 times.
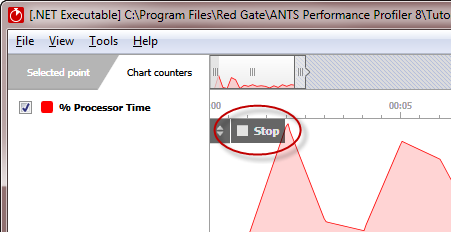
- In ANTS Performance Profiler, click Stop. LatencyDemo closes.
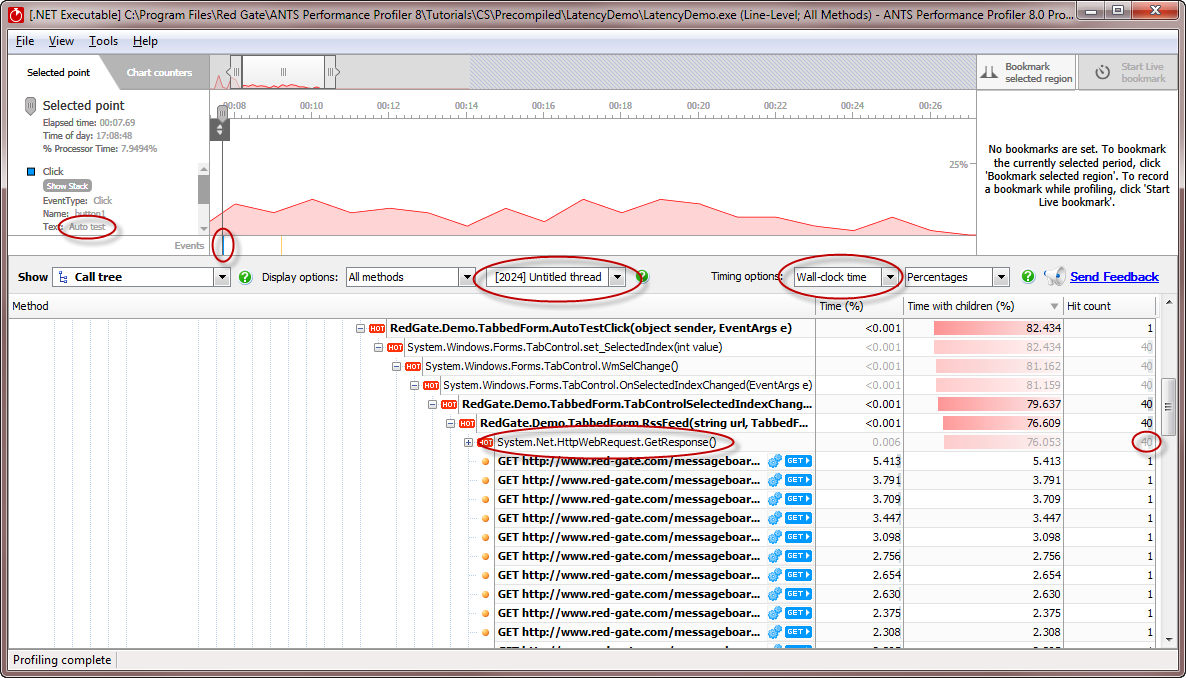
- By clicking the events on the Events bar, find the Method event for a click on Auto test
- On the timeline, drag over the time when the tabs were switching, starting from the Method event
- Look at the hot stack trace. Time is lost by the tab control, but you can't see why.
- Switch to wall clock time.
- You should only look at one thread at a time in wall clock time, so find the UI thread.
- The time is being lost in System.Net.HttpWebRequest.GetResponse()
- Look at the hit count. 40 hits. We're not cacheing the result.


