Working with the methods grid
Published 11 June 2013
The methods grid lists each method that was called by your application during the time period you have selected. Even if a given method is called in several contexts, it is shown only once in the methods grid, with aggregated data that accounts for all contexts.
You can order the data by any column by clicking the column heading. Data is ordered by Time with children by default.
The following data is shown for each method, for the time period you have selected:
- Time: the total execution time for the method (in all contexts).
- Time with children: the total execution time for the method and all its children.
- Hit Count: the number of times the method was called.
Methods listed in bold have source code available. To display the method's source code, click any bold method. Line-level timings are also available in the source-code pane if you used the Line-level and method-level timings; all methods inc. framework or Line-level and method-level timings; only methods with source profiling mode.
Changing the methods-grid display options
You can change the way data is displayed in the methods grid, using the display options on the results toolbar.
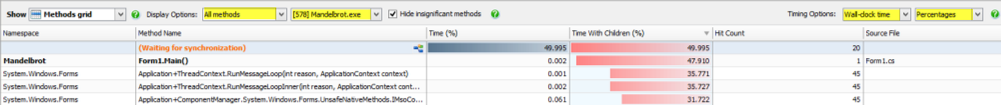
- Display options:
- The left-hand dropdown menu controls whether all methods, or only methods with source, are shown.
If you choose to display all methods, the methods grid will include details for .NET Framework class-library methods. - The right-hand dropdown menu filters the display of stack traces by thread.
- The left-hand dropdown menu controls whether all methods, or only methods with source, are shown.
- Timing options:
- The first dropdown menu controls the way in which method timings are calculated.
You can choose from Wall-clock time which includes blocking such as waiting for I/O, or CPU time which excludes blocking. - The second dropdown menu alters the timing units.
You can choose whether to display time in Percentages, Ticks, Milliseconds, or Seconds.
Choosing Percentages displays the time the method took as a percentage of the period currently selected on the timeline.
- The first dropdown menu controls the way in which method timings are calculated.
Finding particular requests in the methods grid
To find particular methods:
- On the Tools menu, click Find.
The Filter results bar (the Find bar in version 8.0) is displayed beneath the methods grid. - Type all or part of the method name you are looking for.
The methods are filtered to display those that match your text.
This documentation contains proprietary information and is protected by copyright law.
Copyright © 2026 Red Gate Software Limited. All rights reserved


