Working with source code
Published 11 June 2013
When you select a method in the results pane and source code is available for that method, the code is displayed in the source-code pane with the first line of the method body highlighted.
You can also decompile methods from third-party and framework assemblies directly from the call tree, and profile and navigate the resulting code in the same way as the original source code. For more information see Working with integrated decompilation.
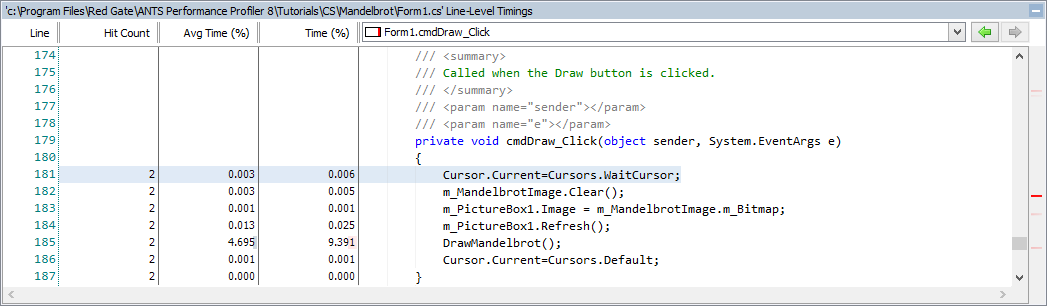
If you used Line-level and method-level timings; all methods inc. framework or Line-level and method-level timings; only methods with source profiling mode, line-level timings are shown for each line of code (as well as average time and hit count).
Line-level timings are not available for Silverlight applications.
To change where the source code pane is, click and hold the source code bar, and drag it to a new location. To hide the source code pane, click ![]() Collapse on the Source code bar (ANTS Performance Profiler 8.6 and later only).
Collapse on the Source code bar (ANTS Performance Profiler 8.6 and later only).
Navigating through source code
You can navigate through the source code for a particular file in several ways:
- To jump directly to lines of code that accounted for the most execution time, use the heat map alongside the vertical scroll bar. Colored bars indicate the location of the slowest lines of code in the source-code file:
Click a bar to jump to the relevant line.The heat map is not available if you did not collect line-level timings.
- To jump directly to a particular method, select the method from the list directly above the source code. A colored bar against each method indicates the relative time spent within the method.
- To jump between methods from within the source code, click the method call. This click-through navigation works for most method calls where the called method has source code available.
- Use the forward
 and back
  history buttons.
You can also create a new call graph from within the source-code pane. Right-click the method that you want to base the call graph on, and select Draw Call Graph > <method name>.
This documentation contains proprietary information and is protected by copyright law.
Copyright © 2026 Red Gate Software Limited. All rights reserved


