Choosing a profiling mode
Published 28 August 2014
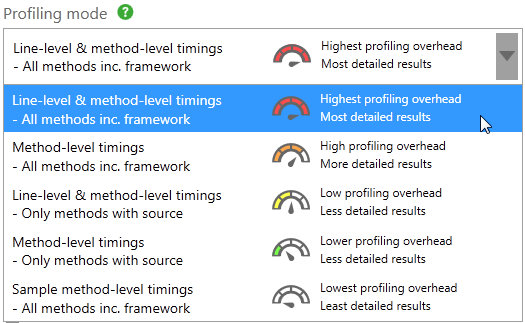
When you set up a profiling session, you select a profiling mode from the drop-down menu on the settings screen.
ANTS Performance Profiler offers up to five profiling modes:
Some profiling modes are only available in ANTS Performance Profiler Professional edition. For details, see the table below.
You might not see line-level timings for partially-trusted assemblies, or assemblies using the SecurityTransparent attribute, even if you select a profiling mode with line-level timings.
For more information, see Profiling SecurityTransparent and partially-trusted assemblies.
Each profiling mode involves a different amount of trade-off between the performance overhead introduced into your application and the amount of detail in the results. Results can be less realistic when the overhead is large, because the profiler estimates this overhead, subtracting it from the timings.
The table below provides an overview of each profiling mode:
Profiling mode | Profiling type | Profiles individual lines of code? | Includes methods without source code? | SQL/ HTTP profiling (Pro only) | Overhead | Detail | Edition required |
Line-level and method-level timings; all methods inc. framework | Instrumented | Yes, if you have source code | Yes (method-level timings only) | Yes | Highest | Most detail | Professional |
Method-level timings; all methods inc. framework | Instrumented | No | Yes | Yes | High | More detail | Professional |
Line-level and method-level timings; only methods with source | Instrumented | Yes | No | Yes | Low | Less detail | Standard or Professional |
Method-level timings; only methods with source | Instrumented | No | No | Yes | Lower | Less | Professional |
Sample method-level timings | Sampled | No | No | No | Lowest | Least detail | Standard or Professional |
Line-level and method-level timings; all methods inc. framework
This mode records profiling results for every line of code in your application that you have source code for. It also records method-level timings for code you do not have the source-code for. The advantage is that this mode gives you the most detailed results, which can help you to identify exactly which line of code is causing the performance problem.
The disadvantage is that this mode introduces a large overhead and reduces the performance of your application, causing it to run slower. This also means that the timings collected will be less accurate because by default the profiler estimates the overhead which it is adding to your application, and subtracts this from the recorded timings. For some very simple functions, this might mean that you see negative timings. (The estimate is most accurate for functions taking at least 1000 clock cycles.)
Method-level timings; all methods inc. framework
In this mode, the profiler profiles all methods, even ones you don't have source code for. It records how many times each of these methods is hit but not how long it takes to execute each line within the methods. This mode is faster than the modes which include line-level timings but it is slightly slower than only profiling methods for which you have source code.
Use this mode if you are not sure whether the performance problem is caused by your code or some third-party code which you do not have source code for. This mode will also record timings for the .NET Framework's own methods.
Line-level and method-level timings; only methods with source
In this mode, the profiler profiles only methods that you have source code for, or methods from code that has already been decompiled. The profiler also records how long it takes each line of code within each method to execute. It gives detailed results but introduces a lot of overhead into your application, so the timings will not be accurate for the reasons described under Line-level and method-level timings; all methods inc. framework.
Method-level timings; only methods with source
In this mode, the profiler profiles only methods that you have source code for, or methods from code that has already been decompiled. It records how many times each of these methods is hit but not how long it takes to execute each line within the methods. For this reason, it is faster than most other modes. This mode does not add much performance overhead to your application, and so the method-level timings are the most accurate.
Use method-level timings if you are certain that the performance problem is in one of your methods (or another method you have source code for) and if obtaining accurate timings is important to help you find the problem.
Sample method-level timings
In this mode, the profiler samples only the performance of your application. It introduces the least overhead but the results are less detailed. Because the mode uses sampling, ANTS Performance Profiler cannot count the number of times each method is hit.
Use Sample method-level timings first if you have a complex application (one with a lot of different methods) which you need to run for a long time so that you can find out where the performance problem is. After you have identified the particular behavior which causes the problem, use one of the other modes to obtain detailed results.
This documentation contains proprietary information and is protected by copyright law.
Copyright © 2026 Red Gate Software Limited. All rights reserved


