The execution plan diagram
Published 22 October 2014
You can use ANTS Performance Profiler to create execution plan diagrams for the SQL calls made by your application.
An execution plan describes how SQL Server executes a query. When a query is submitted to SQL Server, the SQL Server query optimizer evaluates possible execution plans and chooses the plan that's the fastest and uses the least CPU processing and I/O.
You can use information from execution plans to improve the performance of your queries or troubleshoot problems.
ANTS Performance Profiler creates execution plan diagrams using cached execution plans. If you want to view the actual execution plan for a query, you need to run the query in SQL Server Management Studio. For instructions, see How to display an actual execution plan (SQL Server documentation).
Creating an execution plan diagram
To create an execution plan diagram for a query:
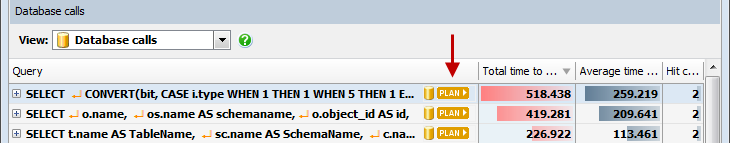
- In the Database calls view, select a query and click
 :
:
The Connect to SQL Server dialog box opens: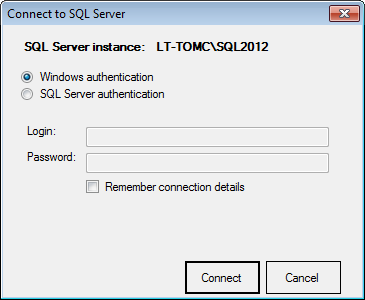
- Enter connection details for the SQL Server instance and click Connect.
The query's execution plan diagram is shown:
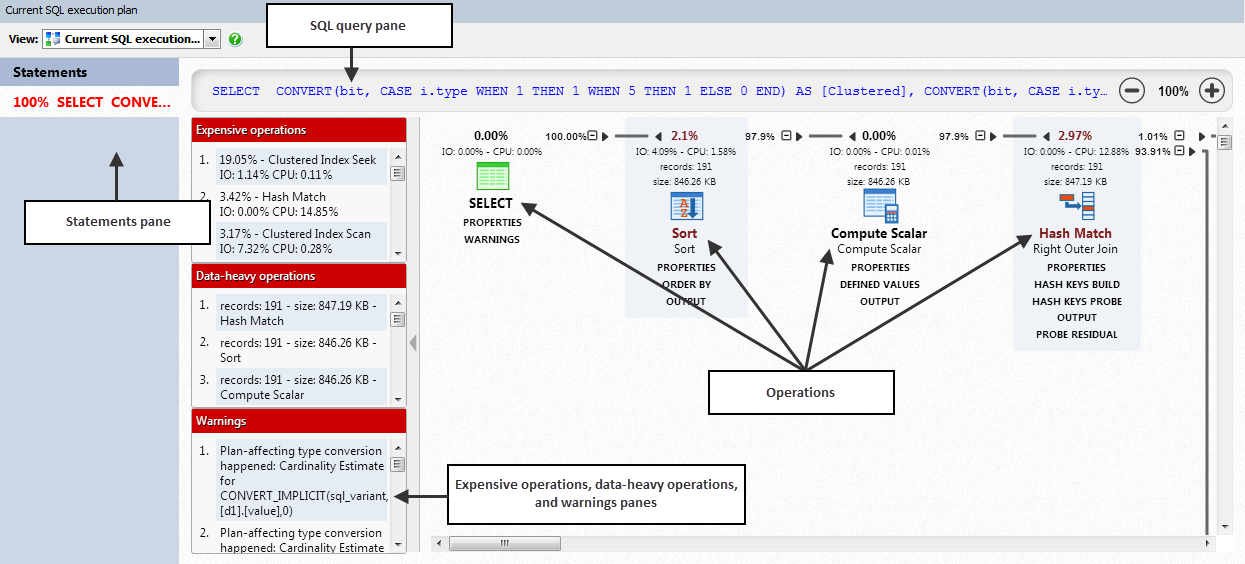
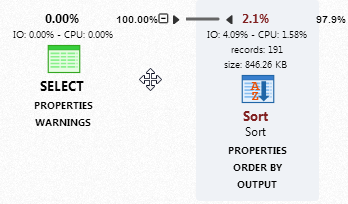
Understanding the diagram
The diagram shows the operations performed by the query (eg nested loops, clustered index seek, etc) and the data passed between them.
For more information about operations in execution plans, see Logical and physical operators reference (SQL Server documentation).
For each operation, the diagram shows:
- relative cost (execution time)
- I/O cost
- CPU cost
- number of records
- row size
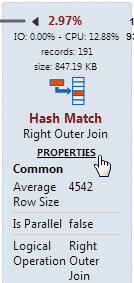
To see more information about an operation, under the operation's name, click Properties:
Statements

The statements pane lists all the statements in the query.
To see the execution plan diagram for a statement, click the statement.
SQL query

The SQL query pane shows the query used to create the plan.
To see the full query in a tooltip, move your mouse pointer over the query text. To see the full query in a new window, click the query text.
Expensive operations, data-heavy operations and warnings
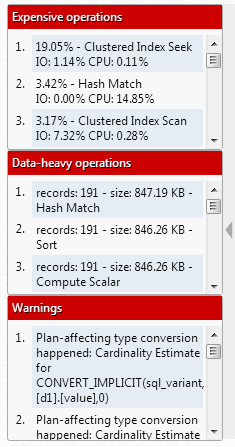
The expensive operations pane shows an ordered list of the most expensive operations. All operations with a cost of more than 1% are listed.
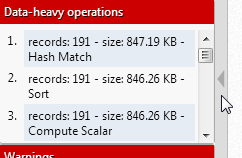
The data-heavy operations pane shows an ordered list of operations that use the most data.
The warnings pane shows a list of potential performance problems.
To highlight an expensive or data-heavy operation in the diagram, click an operation. When you click a warning, the relevant operation is highlighted.
To hide the expensive operations, data-heavy operations and warnings panels, click  :
:
Navigating the diagram
To move around the diagram, click and drag the diagram:
To zoom in and out of the diagram, use the mouse wheel or the zoom buttons:

To reset the zoom to 100%, click the zoom size text:

To collapse a section of the diagram, click  .
.
Exporting a plan
To export an execution plan you've created, from the Current execution plan view, on the File menu, select Export as > SQLPLAN.
You can open exported .sqlplan files in SQL Server Management Studio.
Improving the performance of your queries
You can learn more about execution plans, and how to improve the performance of your queries on MSDN and Simple Talk:
- SQL Server execution plans - Grant Fritchey (eBook)
- Execution plan basics (Simple Talk)
- Graphical execution plans for simple SQL queries (Simple Talk)
- Checklist for analyzing long-running queries (SQL Server documentation)
- Understanding more complex query plans (Simple Talk)
This documentation contains proprietary information and is protected by copyright law.
Copyright © 2026 Red Gate Software Limited. All rights reserved


