The HTTP Requests from client view
Published 28 August 2014
ANTS Performance Profiler collects information on the HTTP requests made to your application by a client; for example when a page is requested in a browser.
HTTP requests from the client are shown in the call tree with a green icon
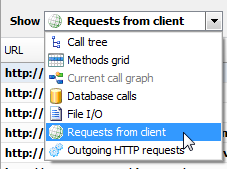
To view all the requests from the client in your profiling session, either click the icon or select the Requests from client view from the drop-down menu:
The Requests from client view is only available in ANTS Performance Profiler Professional edition.
For more information on profiling HTTP requests, see: Profiling web requests (HTTP requests)
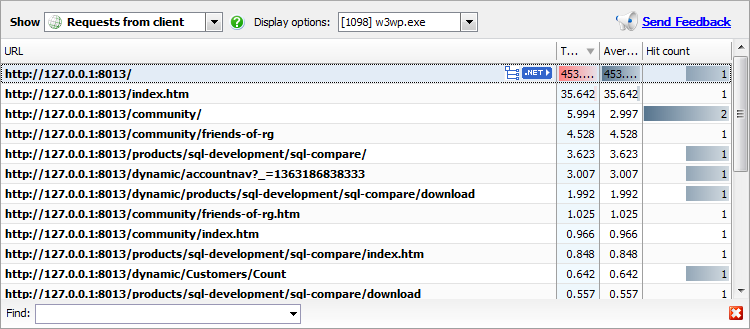
The Requests from client view shows performance data for all the incoming HTTP requests your application received from the client during the selected time period:
HTTP requests from the client are recorded for applications that run on IIS, IIS Express, or the Web Development Sever.
If a URL was requested multiple times, it is only shown once in the Incoming HTTP requests view, with timing and hit count data aggregated from each request.
The following data is shown for each URL, for the time period you have selected:
- URL
The URL requested by the server. - Total time spent generating (ms)
This is the total time spent (in milliseconds) generating all pages with this URL. - Average time to generate (ms)
The average time (in milliseconds) spent generating pages with this URL. This is the total time spent generating a URL divided by the hit count. Hit count
The number of times a URL was requested.
When you select an HTTP request in either the Call Tree or the requests from client view, it's highlighted with green shading in the events bar so that you can see where the request occurred on the timeline.
If the currently selected region of the timeline does not encompass the entire incoming HTTP request, the hit count and time spent generating will be recorded as 'In Progress'. To see the correct performance data, select a region of the timeline that encompasses the entire incoming HTTP request. For more information about the timeline, see The timeline.
Linking back to your code
To find out which methods were called on the server when a particular URL was requested:
- In Incoming HTTP requests view, select the URL.
A icon is displayed on the right hand side of the URL column. Click
The display switches to the call tree view, with the incoming HTTP request selected.
Methods invoked by the incoming HTTP request are shown below it in the call tree, with timing data that can be used to determine whether performance problems are associated with the incoming HTTP request.
Finding particular requests in the Incoming HTTP requests view
- On the Tools menu, click Find.
The Find bar is displayed beneath the Incoming HTTP requests view. - Type all or part of the URL you are looking for.
The URLs are filtered to display those that match your text.


