Dynamic alerting thresholds
Published 06 December 2024
This feature is currently available for the following alerts: Processor (CPU) utilization, Server waits, DTU utilization and Query throughput.
On Linux, additional setup is required to enable Dynamic Alerting.
See the official Microsoft documentation for details: Install extra dependencies for Linux
Support for these alerts is shown below:
Processor (CPU) Utilization
| Operating Systems: | Windows Linux |
| Virtualization: | Azure VMs Amazon EC2 Google Compute Engine |
| Managed Services | Azure SQL DB Azure Managed Instance Amazon RDS Amazon Aurora Azure Flex Google Cloud SQL |
Server Waits
| Databases: | SQL Server |
| Virtualization: | Azure VMs Amazon EC2 Google Compute Engine |
Managed Services | Azure SQL DB Azure Managed Instance Amazon RDS Google Cloud SQL |
Query throughput
| Databases: | SQL Server Postgres |
| Virtualization: | Azure VMs Amazon EC2 Google Compute Engine |
Managed Services (SQL Server) | Azure SQL DB Azure Managed Instance Amazon RDS Google Cloud SQL |
Managed Services (Postgres) | Amazon RDS Amazon Aurora Azure Flex |
DTU utilization
Managed Services (SQL Server) | Azure SQL DB |
Starting from version 14.0.37, Redgate Monitor can use historical machine metrics to predict and dynamically adjust certain thresholds to generate alerts. It achieves this using machine learning models, which are stored and executed locally on the Base Monitor machines.
What is dynamic alerting?
Traditionally, Redgate Monitor uses static thresholds to raise alerts. Alerts can be enabled or disabled, and their thresholds manually adjusted, after gaining a better understanding of the applications and activity patterns on the servers.
Dynamic alerting automates this adjustment of thresholds by using locally running machine learning algorithms to understand and forecast the behavior patterns for each metric. This ensures that your alerts are configured in a bespoke way for each machine and each metric.
All data processing to generate these machine learning forecasts is performed locally on the Base Monitor machine. No data is sent to any third party organizations or entities.
How does dynamic alerting work?
Once enabled, the locally running machine learning models analyze historical data for each specific metric to produce a forecast for the next 24 hours. A small buffer is then added to this forecast to establish an 'expected normalcy.' If the current value of that metric exceeds the expected normalcy predicted for that time, Redgate Monitor will raise an alert.
To generate the forecasts used for dynamic alerting, at least 14 days of past usage data is required. Forecasts are generated when you first enable dynamic alerting and then at 4 AM every day thereafter. Forecasts are only generated for the metric and the machines where they are enabled.
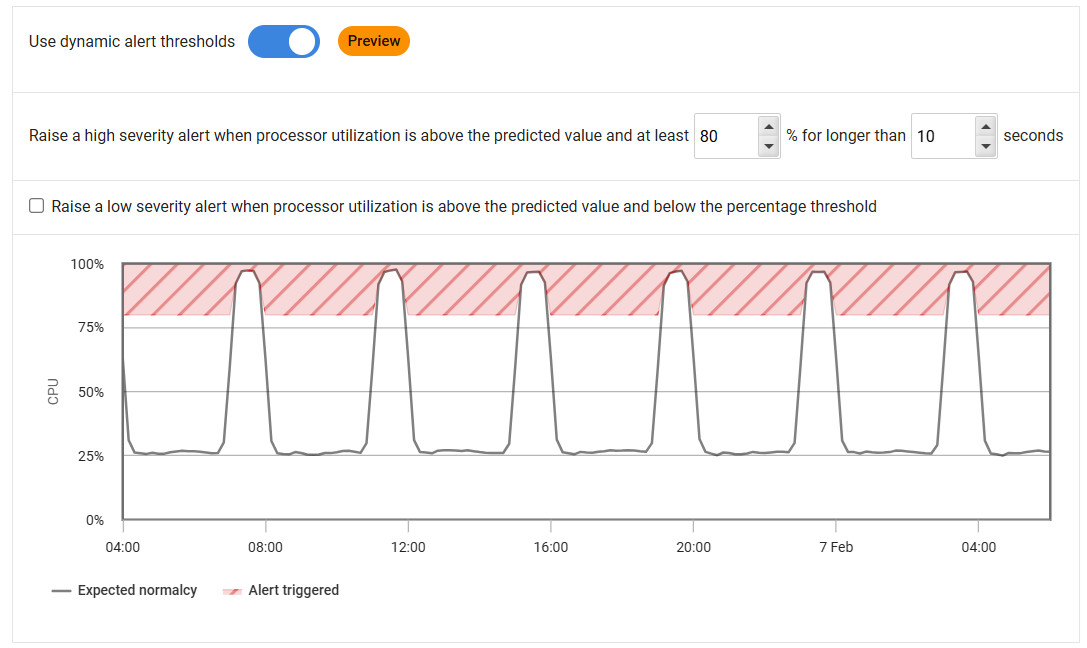
After enabling dynamic alerts, a chart will be displayed showing the expected normalcy for the day (black line).
Alert Settings - Processor (CPU) Utilization, Server Waits and DTU Utilization
The hatched red region indicates the threshold for when an alert will be raised. This region can be configured by adjusting the minimum threshold option, which is set at 80% by default to avoid noisy alerts.
For server waits, the unit of the minimum threshold can also be adjusted, just like for the standard alert. The forecast chart will adjust accordingly.
The duration the metric must stay in that region before an alert is raised can also be adjusted. The default duration is set at 600 seconds for CPU Utilization in order to avoid alerts on short spikes. An alert will be sent if the metric falls within this red region for the set duration.
Checking the "Raise a low severity alert (...)" box will make it so a low severity alert is raised even though the values are under the percentage threshold, as long as they are above the predicted values.
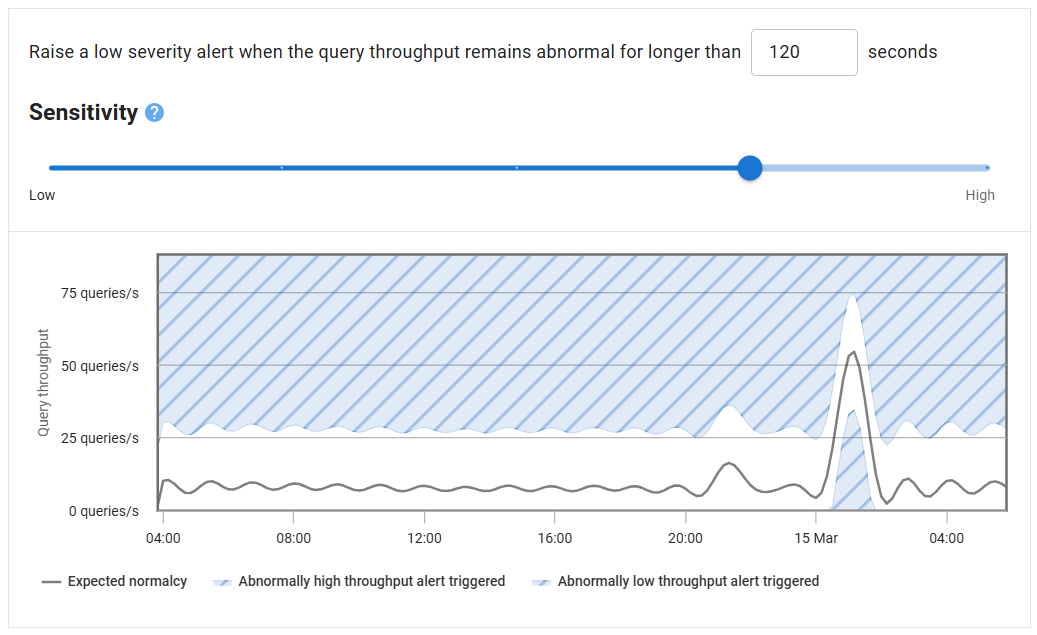
Alert Settings - Query Throughput
The hatched blue region indicates the threshold for when an alert will be raised. The forecasted query throughput is shown on the chart as the Expected normalcy.
The Sensitivity slider can be adjusted to tweak the alert threshold. A higher sensitivity brings the alert threshold closer to the forecast and therefore increases the chances of an alert, whereas a lower sensitivity pushes the alert threshold away from the forecast, therefore decreasing the chances of an alert.
How to enable dynamic alerting?
- Go to Configuration > Alert Settings
- Select either the Processor (CPU) utilization, Server waits, DTU utilization or Query throughput alert
- On the Alert Settings page, choose the host machine (SQL server instance for Server waits) or the group you want to enable dynamic alerting for. The same hierarchy principles of Customizing the alert settings apply here.
- Select the Customize settings for this level and all levels below radio button
- Turn on the Use dynamic alert thresholds toggle if you are configuring Processor (CPU) utilization, Server waits or DTU utilization (the Query throughput alert automatically uses dynamic alerting)
- Once the forecast is generated, you can adjust the threshold and duration options using the input boxes
- Click Apply changes to save the settings
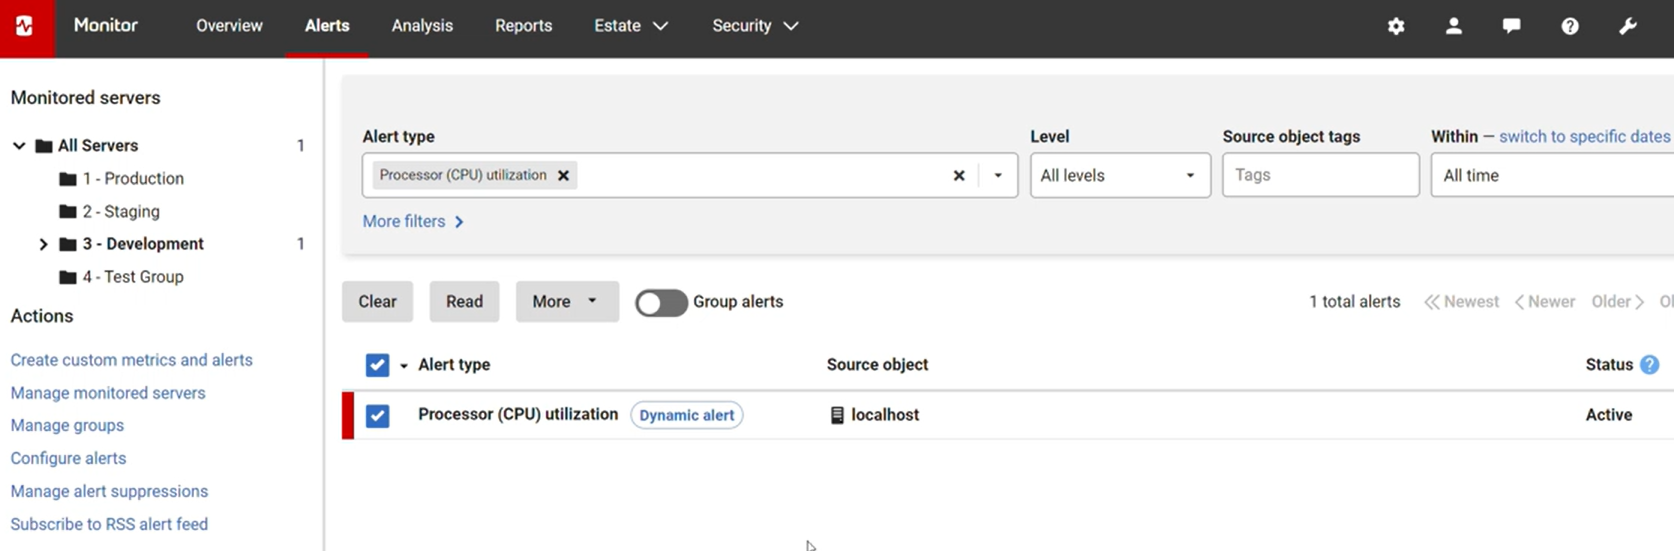
When an alert is triggered using Dynamic Thresholds, it will be marked with a 'Dynamic alert' label in the Alert Inbox.
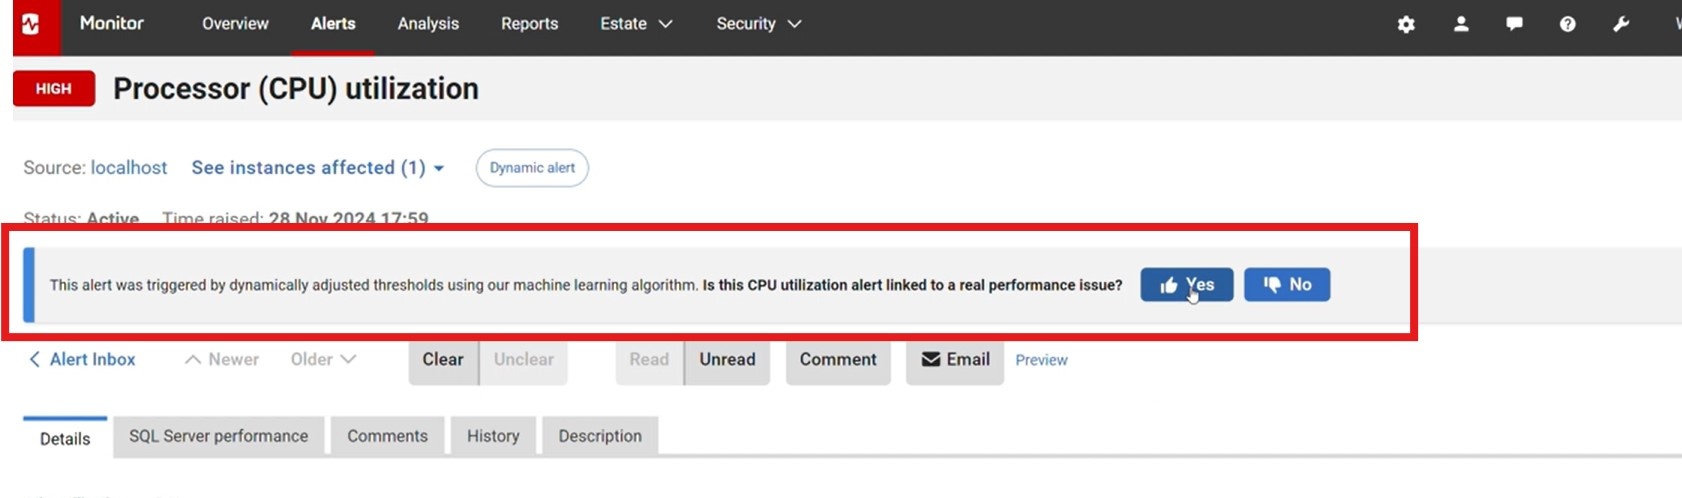
Clicking on an alert opens the Alert Details page, which shows information about each single alert. If the alert is for Processor (CPU) utilization the "Machine: Processor time (%)" chart shows the expected normalcy (that is, the forecast) active for the duration of the alert, in addition to the actual processor values. The Details section shows the current threshold ("Min. threshold"). This information is provided to give an indication as to why an alert may have been raised
Dynamic thresholds are expected to generate fewer alerts compared to static thresholds, helping to reduce unnecessary alerts and highlight significant performance issues. To determine the effectiveness of these alerts, we have included a feedback button with each alert. Your feedback is valuable and will help us improve dynamic alerts. After submitting feedback, you will also see a link to a survey for more detailed input. We are especially interested in knowing if enabling dynamic alerts has any negative impact on identifying performance issues, either by not raising alerts for actual issues or by raising alerts when there isn't a significant performance problem.
Considerations
Forecasts are generated when dynamic alerting is enabled and at 4 AM each day thereafter.
A minimum of 14 days of historical metric data is required for generating forecasts.
Generating forecasts does not significantly impact the Base Monitor's performance. It operates as a low-priority task on the Base Monitor machine. There is a two-hour timeout window for generating forecasts, after which the process is terminated until the next day.
If the historical data is unavailable, or if the forecast generation fails for any reason, the minimum threshold set in the dynamic threshold configuration will be used instead.
This documentation contains proprietary information and is protected by copyright law.
Copyright © 2026 Red Gate Software Limited. All rights reserved


