Setting up script notifications
Published 28 March 2024
Script notifications are currently only available for PowerShell scripts.
About script notifications
You can set up Redgate Monitor to execute a script using the monitor service account as a response to alert notifications.
Script notifications are executed whenever any alert begins, escalates, de-escalates, or ends. You can make use of the alert data object that gets passed as a parameter. See Alert data properties for more details.
Note that like all other notification types, the scripts are configured per Base Monitor.
Security considerations
Monitor will run the script you've provided as the same user that runs the Redgate Monitor Base Monitor service. You should make sure that this user's permissions are as limited as possible in order to avoid security risks.
Enabling this feature should only be done after careful consideration since it could open your system to potential attacks by a bad actor.
Enabling script notifications
By default, script notifications are disabled at the feature flag level.
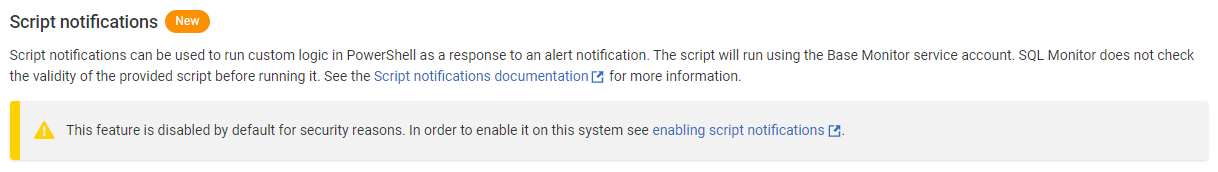
In order to enable script notifications, you need to enable the ScriptAlertResponse feature flag. You can do this by setting the environment variable SQLMONITOR_ScriptAlertResponse to 1.
In order for the change to make its effect, you will need to restart both the Redgate Monitor Base Monitor and the Redgate Monitor Web services.
If you have multiple base monitors, you will need to enable the feature flag on all of the Base Monitors you wish the scripts to run from, plus the Website.
Configuring script notifications
Script notifications can be configured, once enabled, as follows:
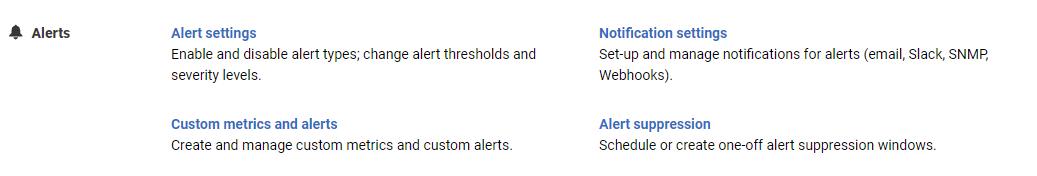
Go to the Configuration page. Under Alerts, select Notification settings. You will need to be an administrator to access this.
Under Script Notifications, click the checkbox and click Proceed.
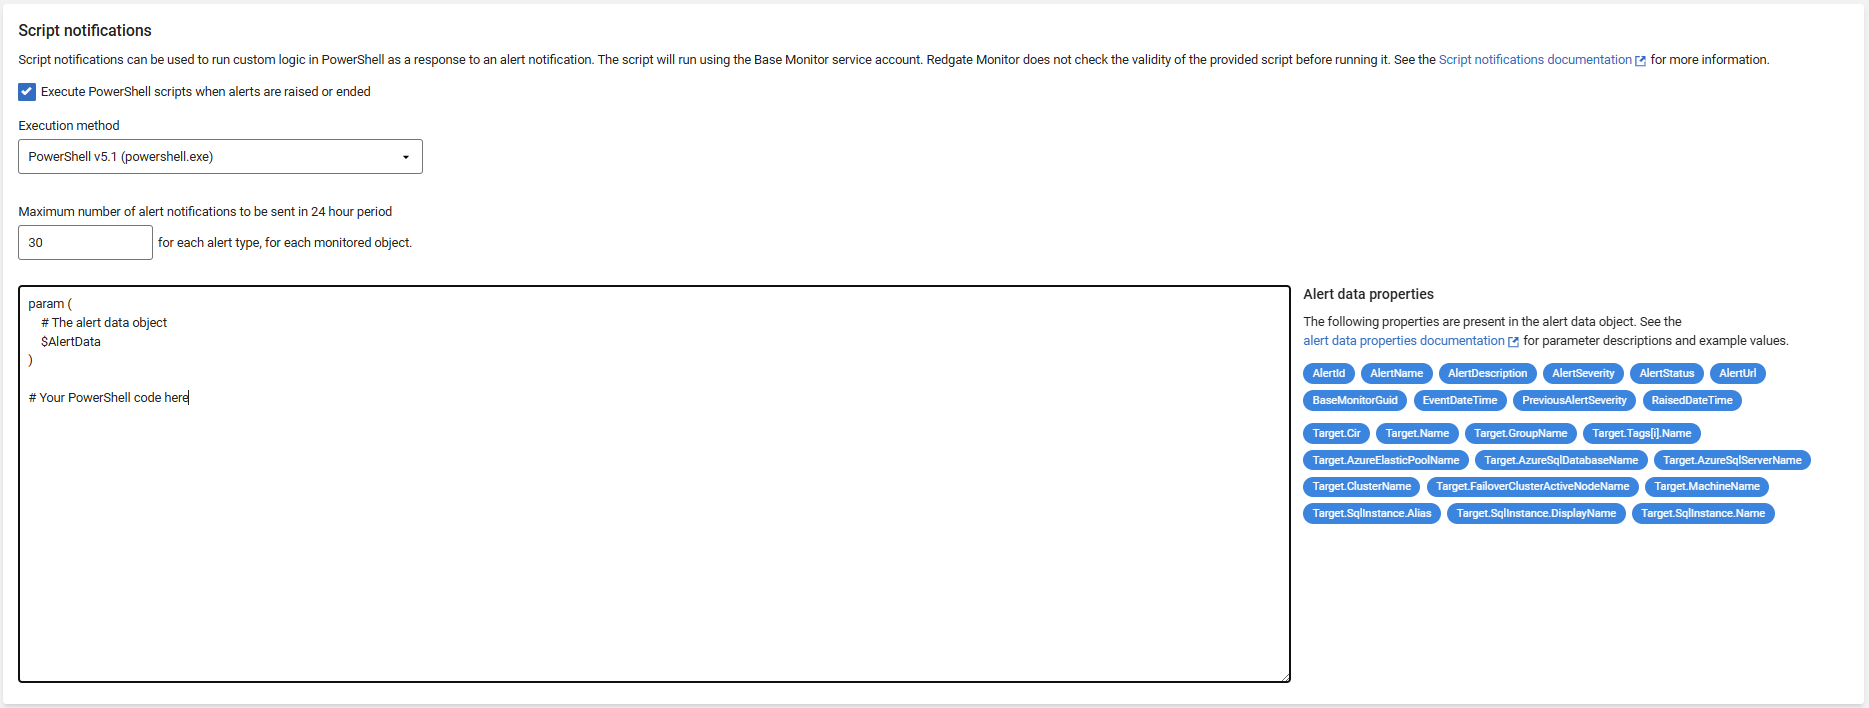
You can then write your PowerShell script inside the box. The parameter $AlertData will be available within the script, containing alert information.
By default the script's working directory is set to the temp directory. This can be changed with the Set-Location -Path "<Current Working Directory>" command.
Note again that this script will only apply to the base monitor selected at the top of the page, if you have multiple.
The executable that runs your script is configurable. This executable is run on its own process outside the main RedGate.Monitor.BaseMonitor process.
You can choose how many notifications each alert type can send for each monitored object in a 24-hour period. The default limit is 30 notifications, and it can’t be set lower than 1.
Alert data properties
The following parameters are present within the $AlertData object and can be used within a script.
| Parameter | Description | Example | Data type |
|---|---|---|---|
| AlertId | Id of the alert | 1234 | Integer |
| AlertName | Name of the alert | Disk space alert | String |
| AlertStatus | Status of the alert | Raised | Enum (None, Raised, Ended, Escalated, DeEscalated) |
| AlertSeverity | Severity of the alert | High | Enum (Unknown, None, Low, Medium, High) |
| AlertUrl | Alert details Url of the alert | https://your-sql-monitor-path/Alerts/localhost/Details/4521988 | String |
| EventDateTime | When this event occurred (different to the raised time for Escalated, DeEscalated, or Ended alert-status types) | 2022-10-12 18:02:12.1651874Z | DateTime |
| RaisedDateTime | When the alert was originally raised | 2022-10-12 17:46:30.2567915Z | DateTime |
| PreviousAlertSeverity | Severity of the previous alert | Medium | Enum (Unknown, None, Low, Medium, High) |
| AlertDescription | Description of the alert | The instance is not running or cannot be contacted on the network. | String |
| AlertDetailText | Extra text fetched during custom metric collection if configured | Additional information from the custom metric's secondary query | String |
| Target.Cir | Channel instance reference of the alert target | Root[].[Cluster][[Name]=failover-cluster.domain.local].[SqlServer][[Name]=node-0\sql2019] | String |
| Target.Name | Name of the alert target | node-0\sql2019 | String |
| Target.GroupName | Name of the group that the alert target is part of | 3 - Development | String |
| Target.ClusterName | Name of the cluster that the alert target is part of (if any) | failover-cluster.domain.local | String |
| Target.MachineName | Name of the machine that the alert targets | DESKTOP-123ABC | String |
| Target.FailoverClusterActiveNodeName | Name of the active node hosting the failover cluster SQL Server instance (iff the alert targets a failover cluster SQL Server instance) | node-0 | String |
| Target.AzureSqlServerName | Name of the Azure SQL Server that the alert is targeting | example-azure-sql-server.database.windows.net | String |
| Target.AzureSqlDatabaseName | Name of the Azure SQL database that the alert is targeting | example-azure-sql-database | String |
| Target.AzureElasticPoolName | Name of the Azure Elastic Pool that the alert is targeting | example-azure-elasticpool | String |
| Target.SqlInstance.Name | Name of the SQL Server instance that the alert is targeting | node-0\sql2019 | String |
| Target.SqlInstance.DisplayName | Display name of the SQL Server instance that the alert is targeting | node-0\(local) | String |
| Target.SqlInstance.Alias | The alias that has been assigned to the sql instance alert target | sql2019 (primary) | String |
| Target.Tags | The list of tags the alert target is tagged with | [ { Name = tag1 }, { Name = tag2 } ] | [ { Name: String } ] |
| BaseMonitorGuid | Guid identifying the Base Monitor service | a1b2c3d4-e5f6-a7b8-c9d0-e1f2a3b4c5d6 | String |
Example script
Here is an example script that writes the alert data object to a JSON file.
Example script
param (
    # The alert data object
    $AlertData
)

# Append alert data object as JSON
$AlertData | ConvertTo-Json | % {"$($_),"} | Out-File -Append -FilePath alert.json
This documentation contains proprietary information and is protected by copyright law.
Copyright © 2026 Red Gate Software Limited. All rights reserved


