Step 3. Test metric
Published 09 February 2026

We recommend testing the query you configured in the previous steps to make sure that data can be successfully collected from monitored objects within a reasonable duration.
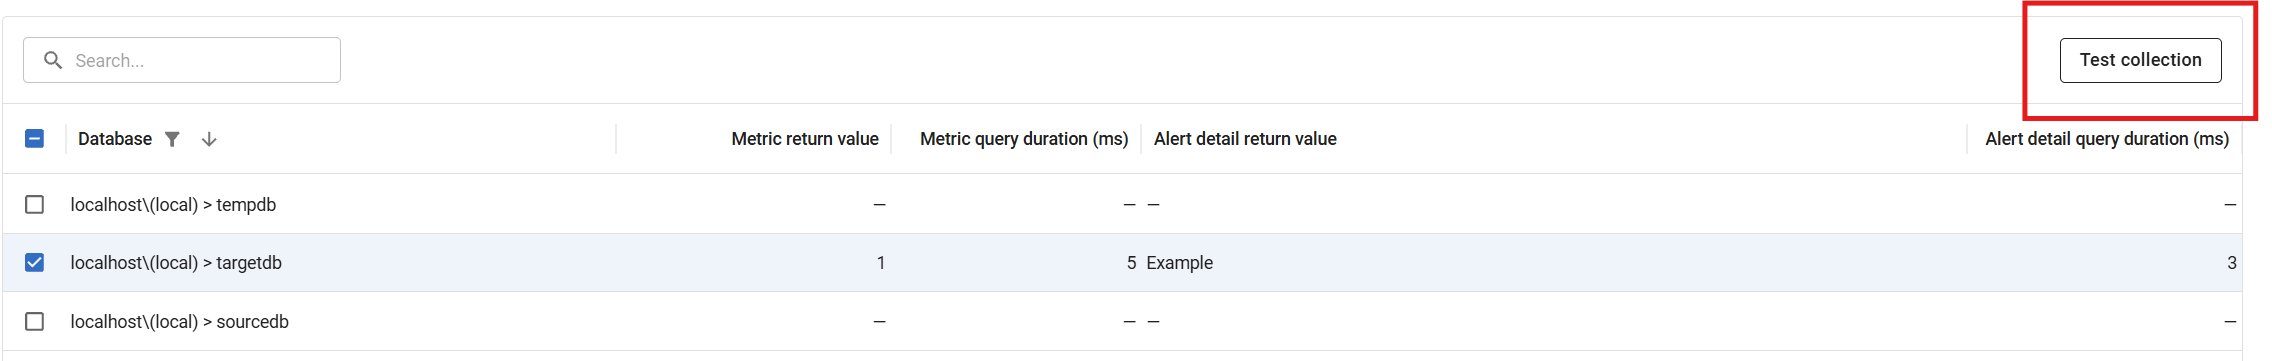
- In the displayed dialog, the databases previously specified are selected by default. If you don't want to test every object, change the selection by unchecking the boxes.
- Click the Test collection button. Redgate Monitor tests the query you configured for the metric data collection once against each selected database and displays its progress at the bottom of the dialog. If you configured an optional Additional alert text query, Redgate Monitor tests this at the same time.
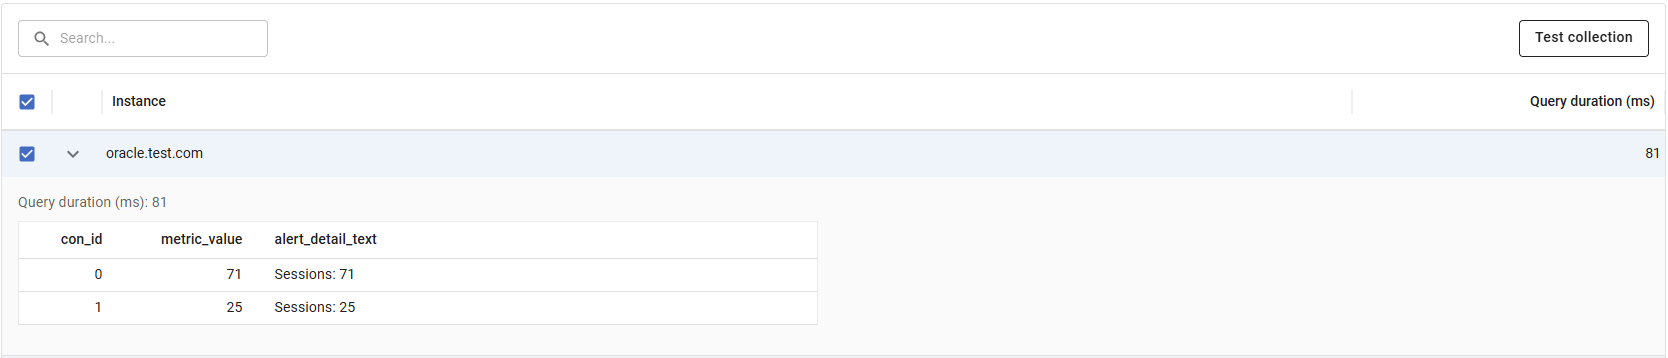
For Oracle, each row can be expanded to see the returned results in a table with columns: con_id, metric_value, and alert_detail_text (if present). If the query failed, the row expands to show the error message instead.
If an object fails the test, or the duration is significantly longer than expected:
- Check the exception or error messages displayed in the Metric return value and Alert detail return value columns.
- Make sure your queries comply with the details mentioned in the Configure metric and Add alert documentation.
- Check for other problems with the query, such as invalid syntax or objects referenced in the query that don't exist in the database.
- Check the Monitored servers page (Configuration > Monitored servers) and the Alert Inbox for status errors or alerts affecting servers hosting selected instances.
Once you've fixed any connection or query problems, retry the test until it completes successfully.
This documentation contains proprietary information and is protected by copyright law.
Copyright © 2026 Red Gate Software Limited. All rights reserved


