Grafana: Dashboards
Published 24 March 2022
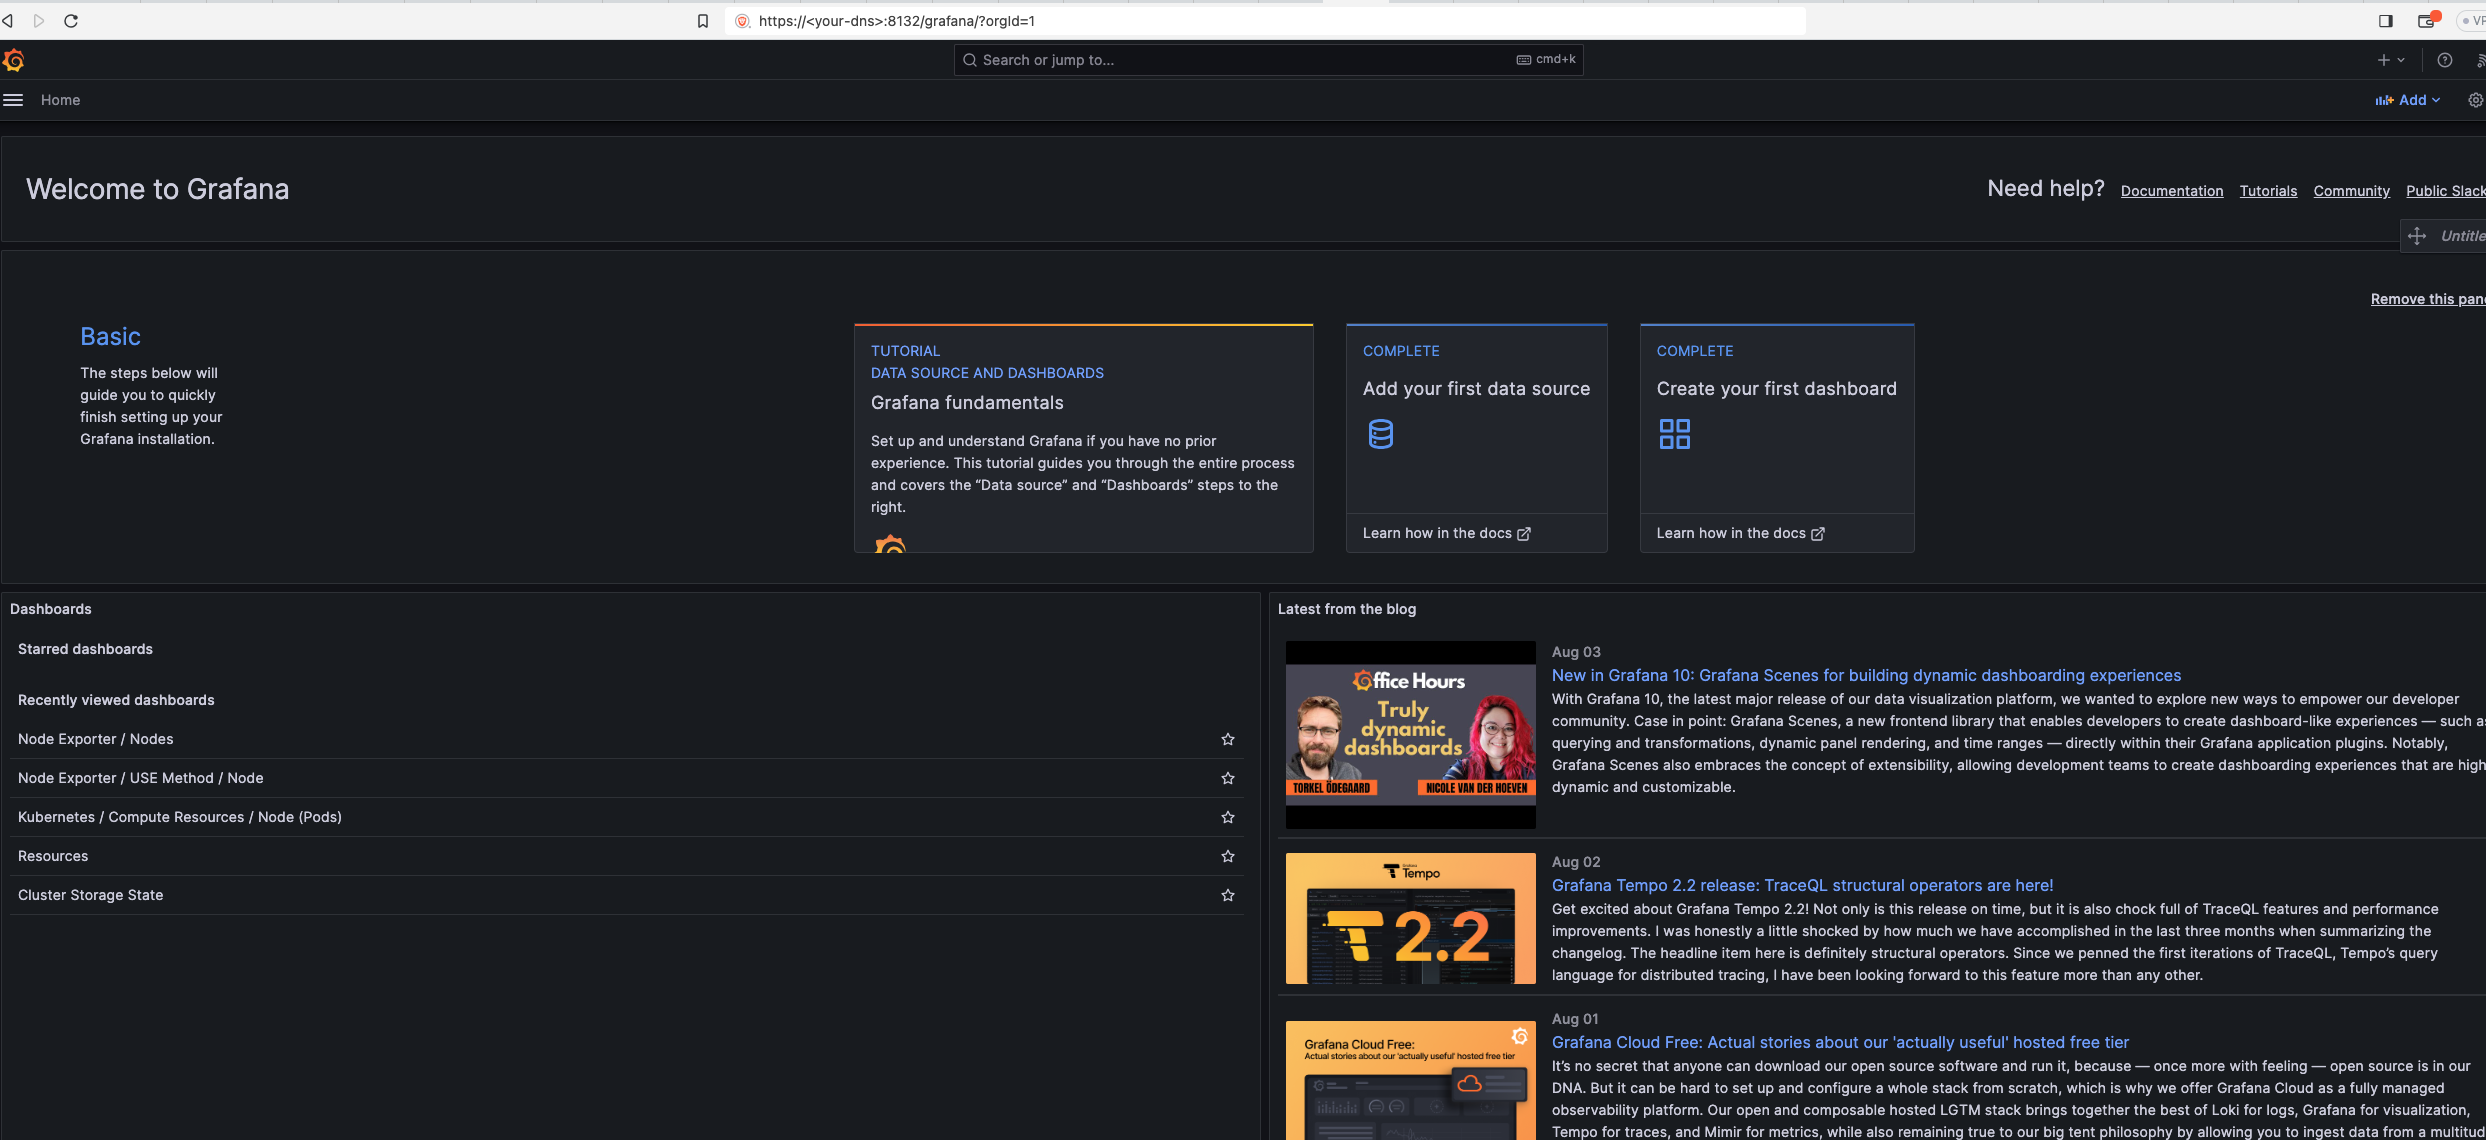
Redgate Clone ships with Grafana and several pre-defined dashboards to help you monitor the hardware usage (i.e. CPU, Memory, Disks)
Contents
Access Grafana Window
For embedded clusters https://<web-api-endpoint>:8132/grafana
For AKS clusters https://<web-api-endpoint>/grafana
You'll need to provide login details, that will be output during Installation steps. If you forget them, please run below commands:
|
Locate the dashboards
At present, we ship a few pre-defined Grafana dashboards out-of-the box and provide general information for Redgate Clone metrics. You can find them by:
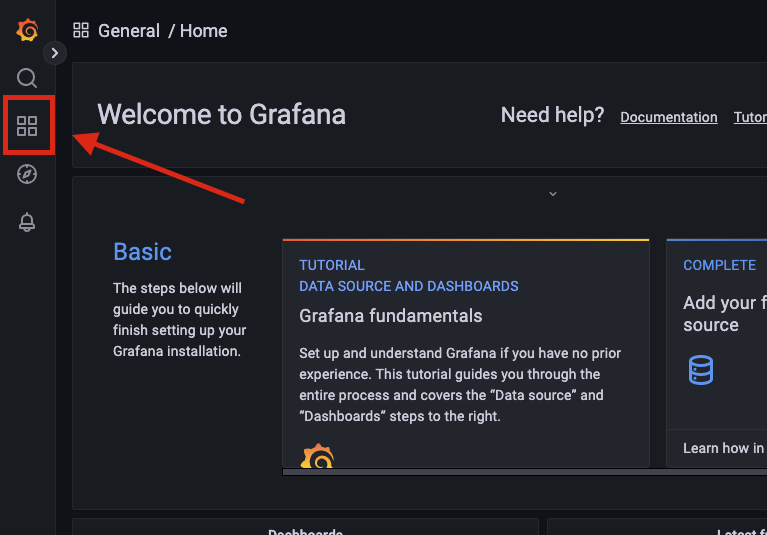
- Selecting Dashboards on the left hand side panel
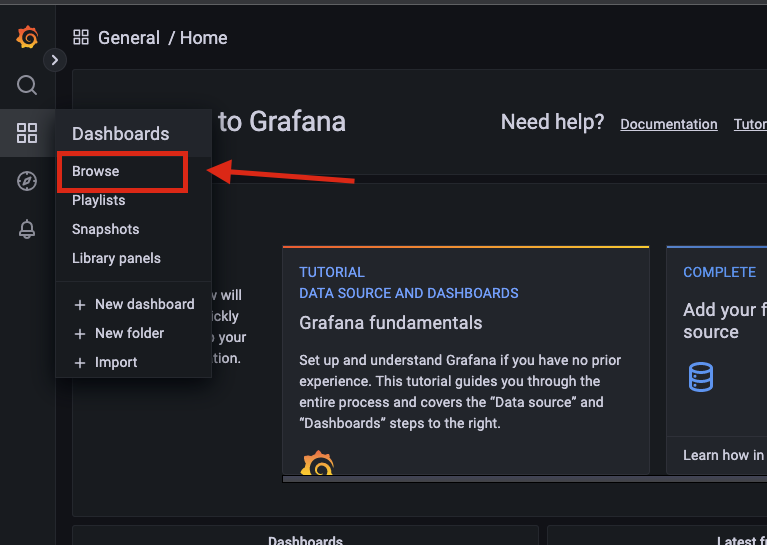
- Clicking on Browse
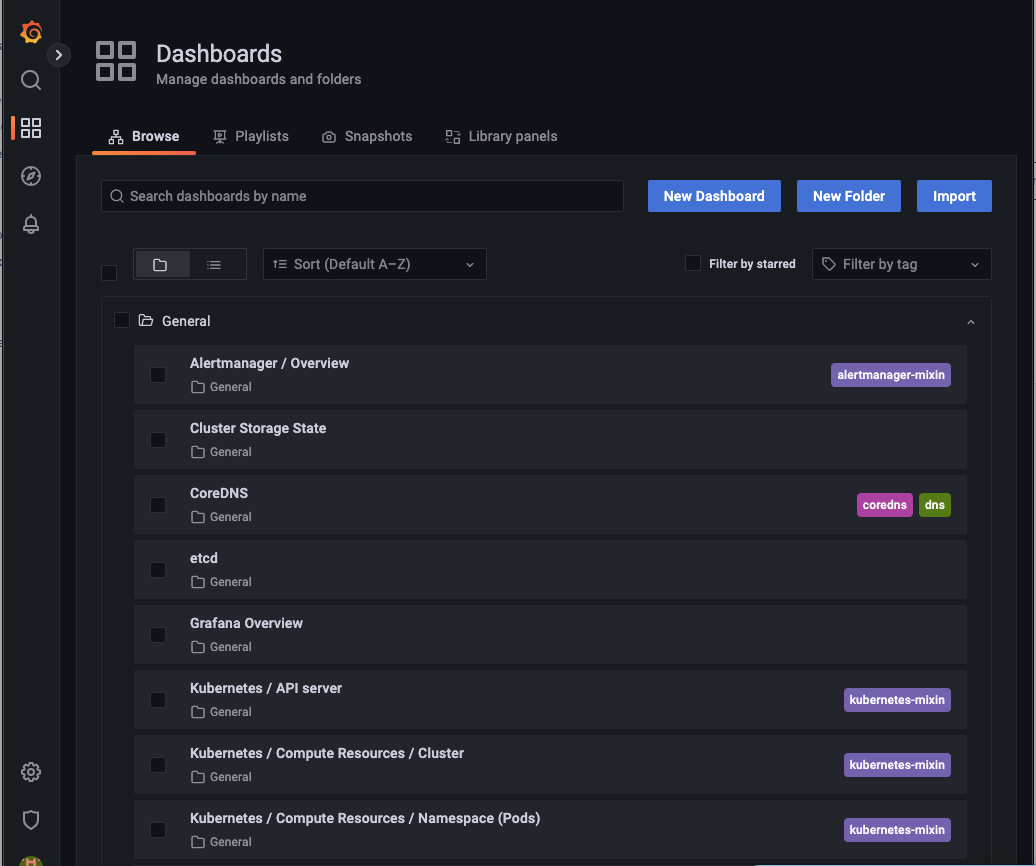
This should bring a screen similar to the one below. Select any of them to display the dashboard.
Custom dashboards
The dashboards are filled with metrics from Prometheus. You can see the metrics by selecting Explore and choosing the prometheus datasource.
Custom dashboards can be created in grafana from the UI by following this guide: Grafana custom dashboards from the UI.
These won't be saved, but can be exported in json format. The exported file can be inserted into a kubernetes config map. If you know how to create a config map on the cluster, then the dashboard can be saved there.
Any config map with the label grafana_dashbaord = 1 and in the monitoring namespace, is automatically loaded.
Below is an example of the definition of a configmap for a dashboard.
|
Available Dashboards
| Dashboard Name | What |
|---|---|
| Cluster Storage State | Monitor attached disk usage |
| Kubernetes / Compute Resources / Cluster | Monitor CPU / RAM & Network bandwith |


