Decoding a stack trace
Published 31 December 2012
If a user sends you a stack trace manually (for example by email), rather than using SmartAssembly's error reporting feature, you may need to decode an obfuscated stack trace manually.
Decoding the stack trace enables you to covert obfuscated code, back to its original form.
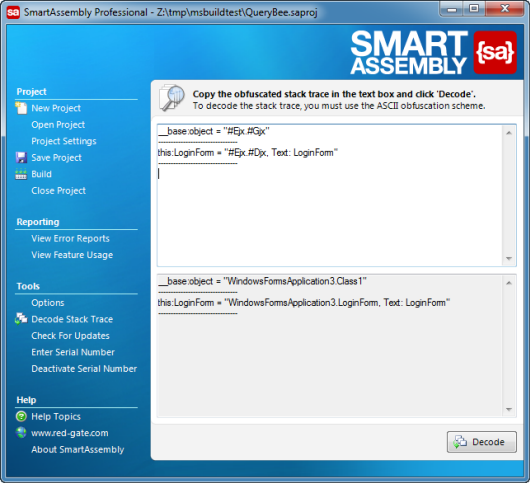
To decode the stack trace, on the main menu, click Decode Stack Trace. The main window displays two text boxes. Paste the obfuscated stack trace into the upper text box and click Decode. The decoded stack trace is shown in the lower text box.
You need to obfuscate using the "I want to use a one-to-one renaming scheme" and "I want to obfuscate using only ASCII characters" name mangling settings to use this feature. If your code cannot be decoded, the obfuscated text is repeated in the lower text box.
If your users submit reports using SmartAssembly's error reporting feature, you will not need to perform this step, because SmartAssembly will decode the stack trace automatically when you download the error report from the web server.
SmartAssembly uses your reports database to decode stack traces, so you might not be able to decode some stack traces if you move your SmartAssembly license to a different computer and do not connect to the same database.
For more information, see Moving SmartAssembly to another computer.
Decoding stack trace using the SmartAssembly SDK
You can also integrate SmartAssembly into your own systems by referencing a RedGate.SmartAssembly.SDK NuGet package.
When referenced, call SmartAssembly.SDK.Helpers.DecodeStackTrace method.


