Preparing to add monitored servers
Published 28 March 2024
If you're adding an instance running on a local network machine, little preparation is required beyond ensuring that the login accounts you supply have sufficient permissions to collect the required monitoring data. However, if the Base Monitor must monitor servers on remote domains, with firewalls involved, it's worth sitting down with your sysadmin to discuss the requirements and considerations beforehand.
This page provides a "preparation checklist" for adding monitored machines and database instances, with links to pages that provide the required details, depending on your requirements:
Preparing to monitor Windows
When automation became key to DevOps processes, PowerShell with "remoting" over WinRM became the obvious way of maintaining and servicing the separate components of a busy and changing IT infrastructure, especially when used with WMI. It is a standard SOAP-based (Simple Object Access Protocol), firewall-friendly protocol that allows hardware and operating systems, from different vendors, to interoperate. Your server estate is best accessed via WinRM so it is worth aiming for this.
- If using WMI over WinRM, go to: WMI over WinRM.
- If using WMI over DCOM, go to: WMI over DCOM.
- If the Base Monitor must make connections to servers in a different network domain, and so navigate firewalls, review Adding servers on a different network from your Base Monitor and Summary of firewall requirements .
Preparing to monitor Linux
For each remote server that you wish to monitor, you will be able to provide the Base Monitor service with SSH credentials that it can use to connect to it.
The associated Linux account does not need any special privileges.
Adding SQL Server instances running on different types of server
Preparing to monitor actual query plans (SQL Server 2019 and above)
Actual query plans are query execution plans that include runtime information.
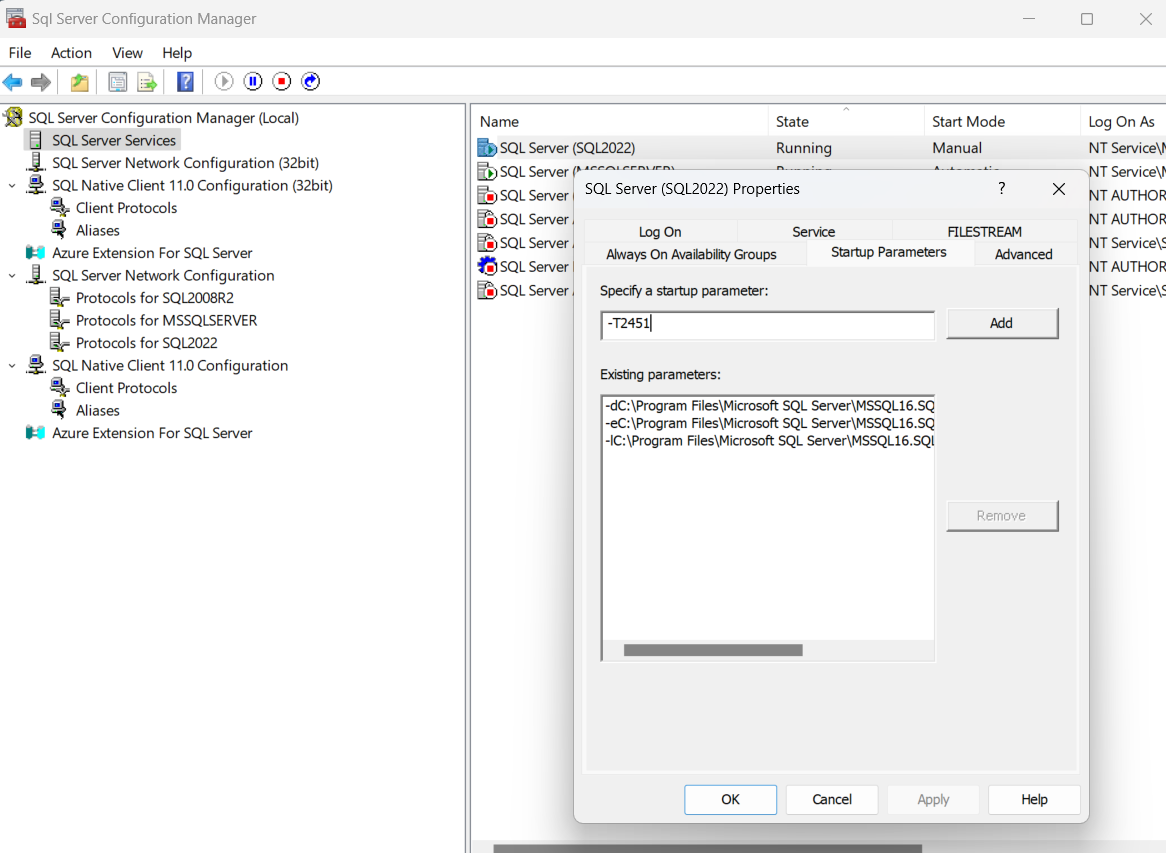
Actual query plan collection can be enabled at the instance level, except for Azure SQL Server, using the trace flag 2451. If set through a T-SQL query this will reset on server restart.
For SQL Server on Windows this can be set permanently by adding to the startup parameters using Sql Server Configuration Manager:
Or at the database level using the LAST_QUERY_PLAN_STATS database configuration option:
Database Configuration Option
ALTER DATABASE SCOPED CONFIGURATION SET LAST_QUERY_PLAN_STATS = ON;
For cloud instances, we recommend using the database configuration option, as there is no way to add the flag to the startup parameters. For Azure SQL Managed Instances, however, there is an option to set up a job that starts automatically with SQL Server Agent and runs the T-SQL query to set on the trace flag. More details about job automation are on the Microsoft documentation.
See this related blog post by Grant Fritchey or the Microsoft documentation page for more details on sys.dm_exec_query_plan_stats and enabling actual plan collection.
Adding PostgreSQL instances
Redgate Monitor uses standard PostgreSQL extensions to provide visibility of PostgreSQL's state. These include pg_stat_statements to track query performance, auto_explain to present query plans, and a foreign data wrapper to allow access to the PostgreSQL error log. You will also need to configure a user that Redgate Monitor will use to log in as, and grant the user permission to see the data it needs. See Preparing PostgreSQL for monitoring.

Resolving connection issues
For security reasons, Redgate Monitor monitors machines and database instances without requiring an "Agent" to be installed on each machine. This reduces the long-term cost and complexity of managing monitoring, but does mean Redgate Monitor can be more sensitive to the network setup than an agent-driven monitoring system (which can provide pre-packaged troubleshooting routines). If you're monitoring instances on a local network, e.g. with machines hosted within a Windows Domain, you'll have no difficulties, of course. Likewise, where network monitoring is already automated with remote scripting, there are few if any issues. Where the WS-Management protocol is already used in a domain or heterogeneous network, you are unlikely to hit problems.
However, if you hit problems connecting to a remote server or instance, we suggest the following:
- Go to Configuration > Monitored Servers, in the web interface, and check the monitoring status, for machine and instance, and the Redgate Monitor logs for the possible source of the problem.
- For Windows machines, interrogate via WMI each of the machines to which you wish to connect and monitor, using the command line, SSMS or PowerShell.
- For Linux machines, similar interrogation should be performed using SSH.
See: What to try if you hit connection problems.
Permissions required to monitor Windows servers and instances
For each remote server that you wish to monitor, you need to provide the Base Monitor service with a login account to connect to it, and with:
- Sufficient permissions on the remote machine to collect the monitoring data.
- Login rights on the machine hosting the Base Monitor service, since Redgate Monitor must be able to authenticate the account locally.
Similarly, you'll need to supply a login account that the Base Monitor service can use to monitor each SQL Server instance.
The Base Monitor service will need to collect detailed diagnostic data from the Windows machine and from each of the monitored SQL Server instances. As such, ideally, the Base Monitor service will either run as a domain account that is both of the following, or will have access to other accounts that are:
- A member of the Windows administrator group on the remote machine.
- If this is not possible, see Monitoring host Windows machines without admin permissions.
A member of the sysadmin fixed server role, on the SQL Server instance.
If this is not possible:
Authenticating using domain accounts
- By default, Redgate Monitor will use the Windows/Active Directory domain account that is running the Base Monitor service to connect both to the Windows machine and the SQL Server instances it hosts. Redgate Monitor supports use of a group managed service account (gMSA).
- However, you can also supply the Base Monitor service with one or more separate accounts to collect the Windows and SQL Server data.
- You add the user account to Redgate Monitor on the Configuration > Monitored servers page, and a domain user is entered with the domain qualifier. You can specify:
- A Windows / Active Directory login on the monitored server to collect data from Windows.
- Either a Windows / Active Directory account or a SQL Server login to collect data from SQL Server.
- You add the user account to Redgate Monitor on the Configuration > Monitored servers page, and a domain user is entered with the domain qualifier. You can specify:
- If you are using an AD-authenticated account to connect between domains, you may need to ensure that there is bi-directional trust between them.
Authenticating using non-domain accounts
To connect to remote machines, Redgate Monitor must authenticate the user locally, to the machine where the Base Monitor is installed. Therefore, with non-domain user accounts, you need to have on each machine (the Base Monitor machine and the remote machine) the same local user with the same password (i.e. UserName1 with Password1 must exist on both machines).
- Add the user to Redgate Monitor on the Configuration > Monitored servers page as .\UserName1 so that it will use the user local to each machine. This will be automatically changed to display as UserName1@, but don't worry about this.
- You may also need to add the registry key specified in this article to stop the UAC from reducing the user's privilege when accessing the machine remotely (this is on the machine you want to monitor).


