Configuring Profiler trace
Published 28 March 2024
Enabling trace allows you to continuously capture SQL Profiler trace data on the selected instance. When an alert is raised, the SQL statements that were executing around the time of the alert are displayed under SQL Processes in the Performance data section for that alert.
Configuring trace
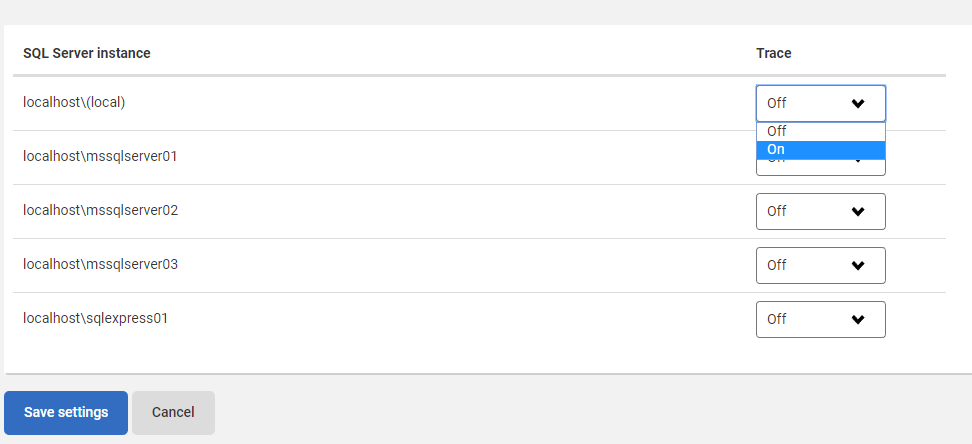
- Go to the Configuration page. Under Advanced, select Trace.
- For each SQL Server instance you want to store trace data for, Select On from the Trace drop-down list, then click the Save settings button.
Warning icons are displayed to make it easier to see which instances on the page have trace enabled: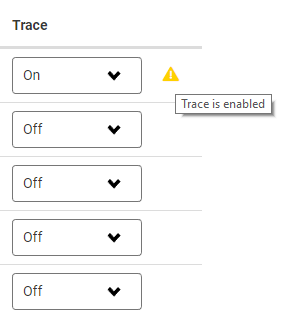
What trace data is captured?
The following trace information is captured (SQL Server event number in brackets):
- RPC_Starting (11)
- SQL_BatchStarting (13)
- Audit_Login (14)
- Attention (16)
- SQL_Exception (33)
When is trace data stored?
Trace data is stored in response to any of the following alerts for on-premise Windows SQL Server instances:
- Blocking process
- Deadlock alert
- Deadlock extended event
- Database instance error log entry
- Job failure
- Job cancelled
- Job duration unusual
- Long running query
- Page life expectancy
- Server wait
- Version store usage
Where trace data can be found
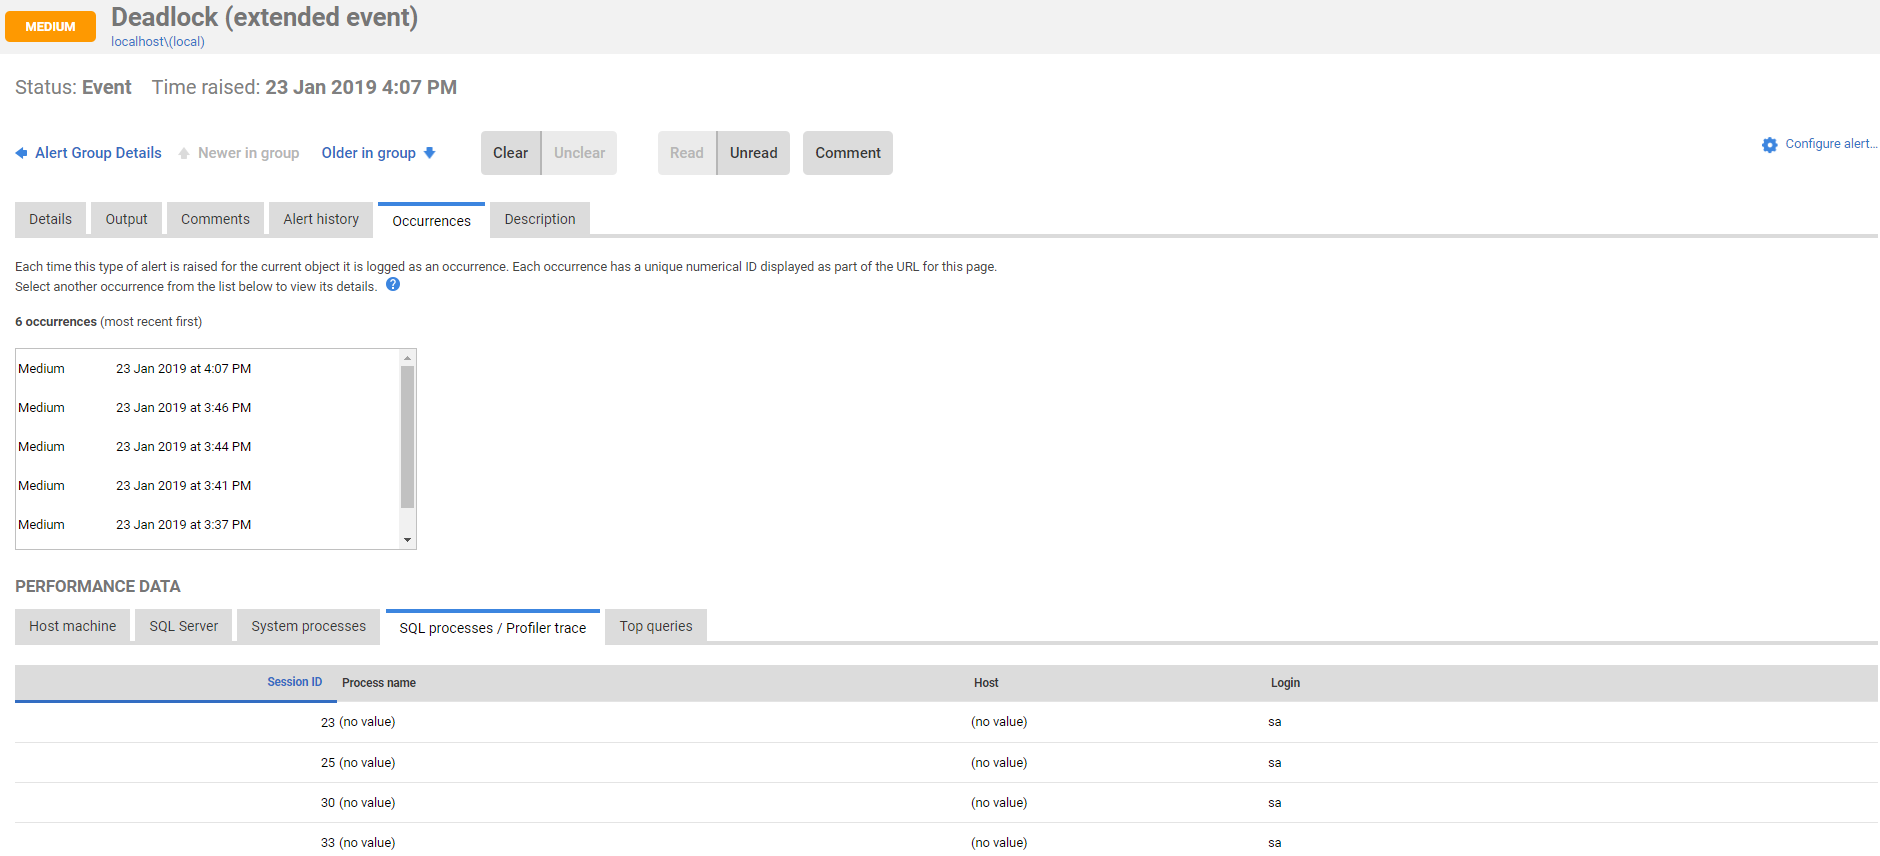
When trace is enabled, you can find it on the Alert Details page under the SQL processes / Profiler trace tab:
Trace data retention
If trace is enabled, a trace data file is stored locally on the monitored server. Sections of the data file from around the time an alert was raised are copied to the Redgate Monitor Data Repository. When you click on an alert in the Alert Inbox to display more details, the trace data is retrieved from the Data Repository.
Note: To prevent the trace data file from taking up excessive storage space on the monitored server, it is automatically deleted after it has remained on the server for 15 minutes, or reaches 1 GB in size.
Trace data stored in the Data Repository is categorized separately for the purposes of data retention. To specify how long to keep stored trace data in the Data Repository, use the SQL trace data option on the Data retention page (Configuration > Data retention).
This documentation contains proprietary information and is protected by copyright law.
Copyright © 2026 Red Gate Software Limited. All rights reserved


