Integrating with ServiceNow
Published 28 March 2024
ServiceNow ® can flexibly respond to Redgate Monitor's webhook messages, allowing Redgate Monitor's alerts to be handled as part of an organization's unified incident management process. In this example, we'll build a Scripted REST API resource in ServiceNow to receive webhooks describing Redgate Monitor alerts, using the information provided to create and update ServiceNow incidents. The key steps involved are:
- Create a Scripted REST API endpoint in ServiceNow to receive webhook messages
- Define a script in ServiceNow to manage incidents in response to the webhooks
- Configure Redgate Monitor to send webhook messages to this new endpoint
Further information on configuring ServiceNow
Note that the following summary information on configuring ServiceNow's Scripted REST APIs is provided for convenience only, and Redgate isn't able to provide personalized support for configuring ServiceNow. For more detailed guidance, refer to ServiceNow's own documentation on the topic, in particular paying attention to security measures. This walkthrough uses the ServiceNow Tokyo release - some details may differ for other releases.
Requirements
- Redgate Monitor 12.1.37+, with an administrator account for configuration.
- The
web_service_adminrole in your ServiceNow environment. - Network connectivity between Redgate Monitor's Base Monitor service(s) and the ServiceNow environment.
Create the Scripted REST API resource
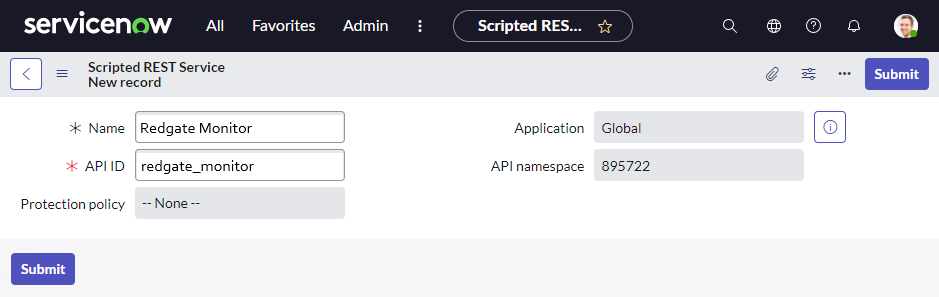
In ServiceNow, search for Scripted REST APIs, and select New.

Name the service "Redgate Monitor" or similar.
Make a note of the "Base API path" field shown - this will be used later to form the endpoint url which Redgate Monitor will send webhooks to. Within this new service, in the Resources section click New to create a new record.
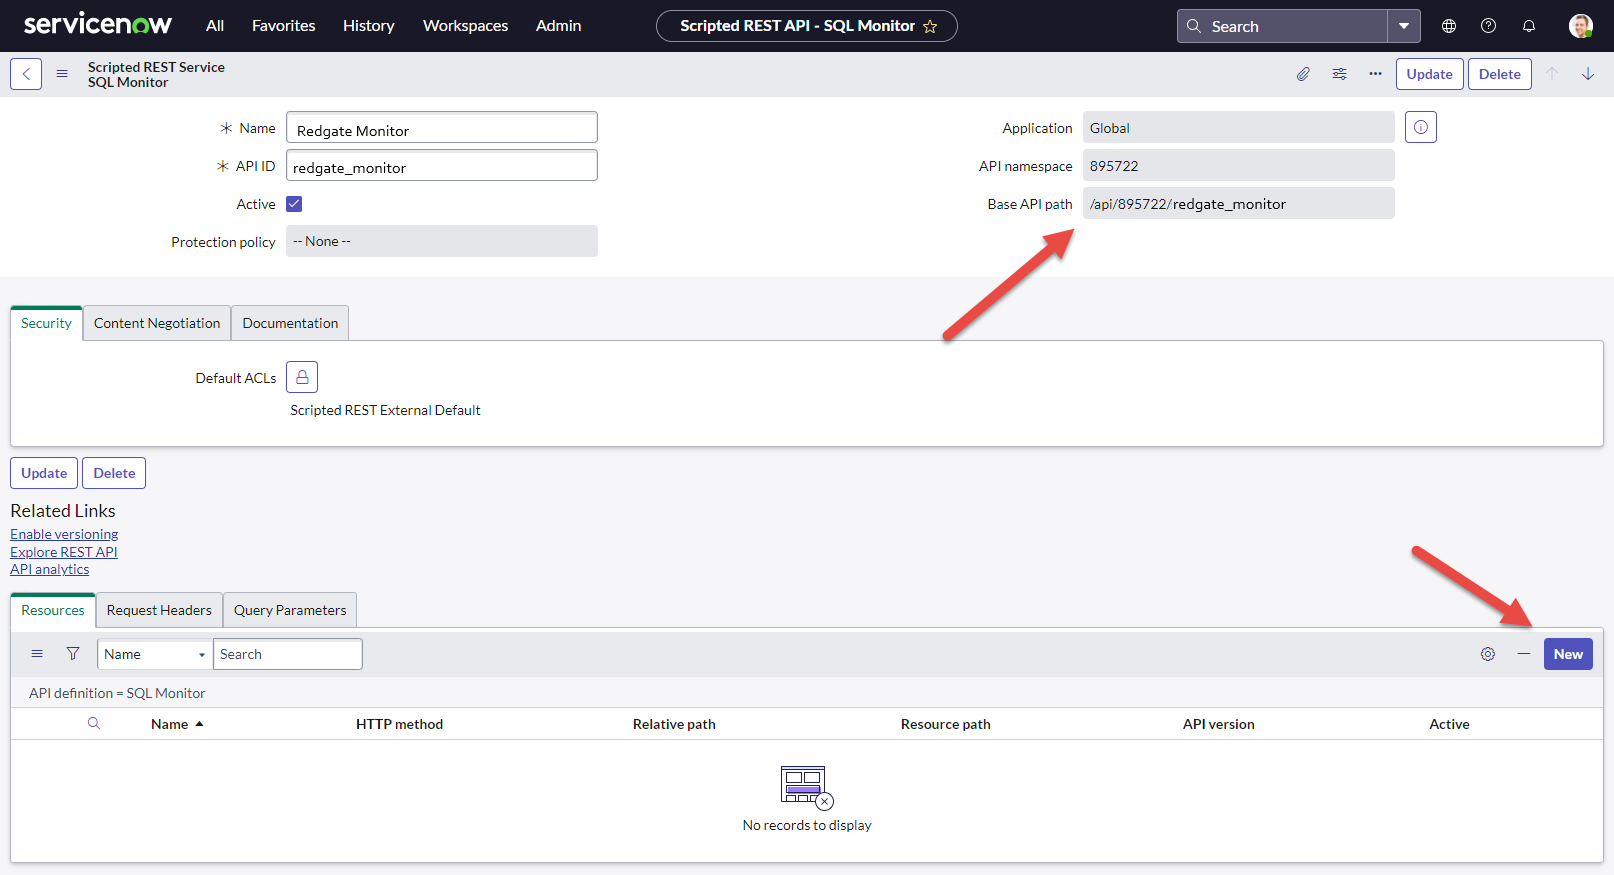
Name the record "Alert" or similar, change the HTTP method to "POST", and ensure that the "Active" state is selected. By default the new endpoint should be set to require authentication and use ACL authorization - review the ACL settings to confirm they are appropriate for your environment (these can be edited later).
The Script section describes the logic of how incidents should be created and updated in response to received webhooks, and will be customized in the next step.

Script to handle the webhook
Every organization makes different choices about how to configure ServiceNow and may wish to consume webhook notifications from Redgate Monitor differently. This script is provided only as an example, as a starting point for customization. Briefly, it:
- Checks that the message type is AlertNotification as expected.
- If the alert status is Raised:
- An incident is created with the New state.
- A Description and Short Description for the incident are built from properties provided in the webhook, including details of the Redgate Monitor url to visit for more details.
- Based on the severity provided in the webhook, the Impact and Urgency fields are given values, which ServiceNow uses to create a mapped Priority field.
- A Correlation Id field is populated with data which can uniquely identify a Redgate Monitor alert, so that updates from Redgate Monitor can later be applied to the correct ServiceNow incident.
- If the alert status is Escalated or DeEscalated:
- An incident should already exist for this alert, and is looked up based on the Correlation Id.
- The incident's Impact and Urgency (and hence Priority) are updated to match the new severity provided by Redgate Monitor.
- If the alert status is Ended:
- An incident should already exist for this alert, and is looked up based on the Correlation Id.
- The incident's State is set to Resolved, with the Resolution Code "Resolved by caller".
Common adaptations to this script may include specifying additional properties for the incident, including by referencing other properties supplied by Redgate Monitor (documented here). It may also be desirable to alter the logic of the behaviour and mapping from Redgate Monitor into ServiceNow, for example choosing different impacts and priorities, marking a ticket as closed instead of resolved, or using custom closure codes.
Redgate Monitor version requirement
This script requires Redgate Monitor 12.1.37 or above because it uses the baseMonitorGuid property from Redgate Monitor's webhook, which is only included from that version onwards. Using this script with older versions of Redgate Monitor which lack that information will cause collisions in the ServiceNow Correlation Id (which must be unique) if webhooks from multiple Redgate Monitor Base Monitor services are fed into a single ServiceNow environment. That happens because while a Redgate Monitor alert id is unique for any given Base Monitor service, it is not globally unique across all Base Monitor services, so must be further distinguished using the Base Monitor's identifier.
(function process(/*RESTAPIRequest*/ request, /*RESTAPIResponse*/ response) {
    var event = request.body.data;
    gs.info("Redgate Monitor webhook log: " + JSON.stringify(event)); //Log to ServiceNow for debugging
    var responseBody = {};
    if (event.messageType == 'AlertNotification') { //Provided in all Redgate Monitor webhooks
        var rgmCorrelationId = 'RedgateMonitor.' + event.baseMonitorGuid + '.' + event.id; //Alerts uniquely identified by BM + alert id combo
        if(event.statusChange == 'Raised') { //A new alert
            var alertTarget = event.monitoredEntity.name;
            var inc = new GlideRecord('incident');
            inc.initialize();
            inc.short_description = 'Redgate Monitor: ' + event.name + ' on ' + alertTarget;
            var description = 'Raised against: ' + alertTarget + '\r\n\r\n';
            description += event.description + "\r\n\r\n";
            description += 'For more details view this alert in Redgate Monitor at ' + event.detailsUrl;
            inc.description = description;
            inc.correlation_id = rgmCorrelationId; //Store a Redgate Monitor identifier so we can look it up when receiving future updates
            inc.state = 1; //New
            if(event.severity == 'High'){
                //High impact + medium urgency results in high priority using default lookup rules
                inc.impact = 1; //High
                inc.urgency = 2; //Medium
            }
            if(event.severity == 'Medium'){
                //Medium impact + medium urgency results in moderate priority using default lookup rules
                inc.impact = 2; //Medium
                inc.urgency = 2; //Medium
            }
            if(event.severity == 'Low'){
                //Low impact + medium urgency results in low priority using default lookup rules
                inc.impact = 3; //Low
                inc.urgency = 2; //Medium
            }
            inc.insert(); //Save
            responseBody.message = 'Incident created';
            response.setBody(responseBody);
        } else { //Update to an existing alert
            var existingIncident = new GlideRecord('incident');
            existingIncident.addQuery('correlation_id', rgmCorrelationId); //When creating an incident, we stored Redgate Monitor's identifier
            existingIncident.query();
            if (existingIncident.hasNext()) {
                existingIncident.next();
                if(event.statusChange == 'Ended') {
                    existingIncident.state = 6; //Resolved
                    existingIncident.close_code = 3; //Resolved by caller. By default can't be blank.
                    existingIncident.close_notes = 'Closed by Redgate Monitor after alert ended.'; //By default can't be blank.
                    existingIncident.update(); //Save
                    responseBody.message = 'Incident closed.';
                    response.setBody(responseBody);
                }
                if(event.statusChange == 'Escalated' || event.statusChange == 'DeEscalated') {
                    if(event.severity == 'High'){
                        //High impact + medium urgency results in high priority using default lookup rules
                        existingIncident.impact = 1; //High
                        existingIncident.urgency = 2; //Medium
                    }
                    if(event.severity == 'Medium'){
                        //Medium impact + medium urgency results in moderate priority using default lookup rules
                        existingIncident.impact = 2; //Medium
                        existingIncident.urgency = 2; //Medium
                    }
                    if(event.severity == 'Low'){
                        //Low impact + medium urgency results in low priority using default lookup rules
                        existingIncident.impact = 3; //Low
                        existingIncident.urgency = 2; //Medium
                    }
                    existingIncident.update(); //Save
                    responseBody.message = "Incident severity updated.";
                    response.setBody(responseBody);
                 }
            } else {
                response.setError(new sn_ws_err.NotFoundError('Unable to find existing incident using correlation_id ' + rgmCorrelationId));
            }
        }
    } else {
        response.setError(new sn_ws_err.BadRequestError('MessageType not recognised.'));
    }
})(request, response);
Configure Redgate Monitor
In Redgate Monitor, navigate to Configuration → Notification Settings. In the Webhook Notifications section, select "Send webhook messages when alerts are raised or ended".
Use headers to provide authentication details. It's strongly recommended that you use a dedicated account in ServiceNow to manage webhooks received from Redgate Monitor - more guidance on authentication and authorization using Access Control Lists is available through ServiceNow's documentation.
Basic authentication example
ServiceNow supports multiple authentication types - in this example we use the Basic authentication approach. Under this authentication mechanism, combine the username and password for the ServiceNow account you wish to use, separated by a single colon, into a string, and base 64 encode that value to obtain the credentials to supply to ServiceNow. For example, here we use an account called redgatemonitor with password Y3ic$v6!Acfk10y*Wky5. This combined value redgatemonitor:Y3ic$v6!Acfk10y*Wky5 is base 64 encoded, leading to the credential cmVkZ2F0ZW1vbml0b3I6WTNpYyR2NiFBY2ZrMTB5KldreTU=. In Redgate Monitor, we create a header with name "Authorization" and value "Basic cmVkZ2F0ZW1vbml0b3I6WTNpYyR2NiFBY2ZrMTB5KldreTU=".
Select "Default message" for the message - there's no need to customize the webhook payload, because the above script is designed to interpret Redgate Monitor's default payload in ServiceNow.
The URL is constructed by combining the root of your ServiceNow account, in this case https://xyz.service-now.com, with the "Base API Path" noted when creating the ServiceNow Scripted REST API resource.
At the bottom of the page, click "Save settings".
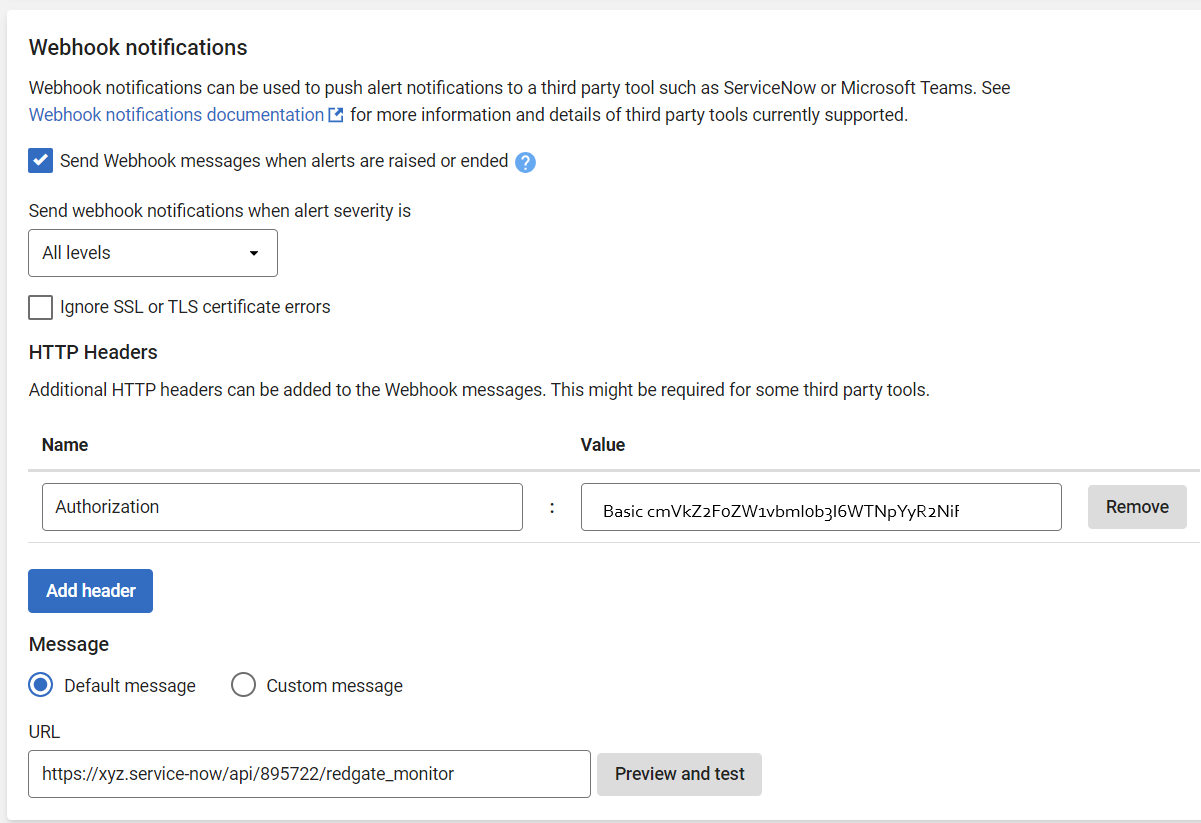
For testing purposes, you can also click "Preview and test". The test webhook message sent by Redgate Monitor uses the status "Escalated", causing the script above to search for an incident with an existing correlation id. Since no such incident will exist, you will receive a failure response from ServiceNow, with a message similar to this. Nonetheless, the "Preview and test" option can be useful for testing that the authentication process is working - you will receive a different error message if it isn't.
{
  "error": {
    "message": "Unable to find existing incident using correlation_id RedgateMonitor.a1b2c3d4-e5f6-a7b8-c9d0-e1f2a3b4c5d6.12345",
    "detail": ""
  },
  "status": "failure"
}
Results
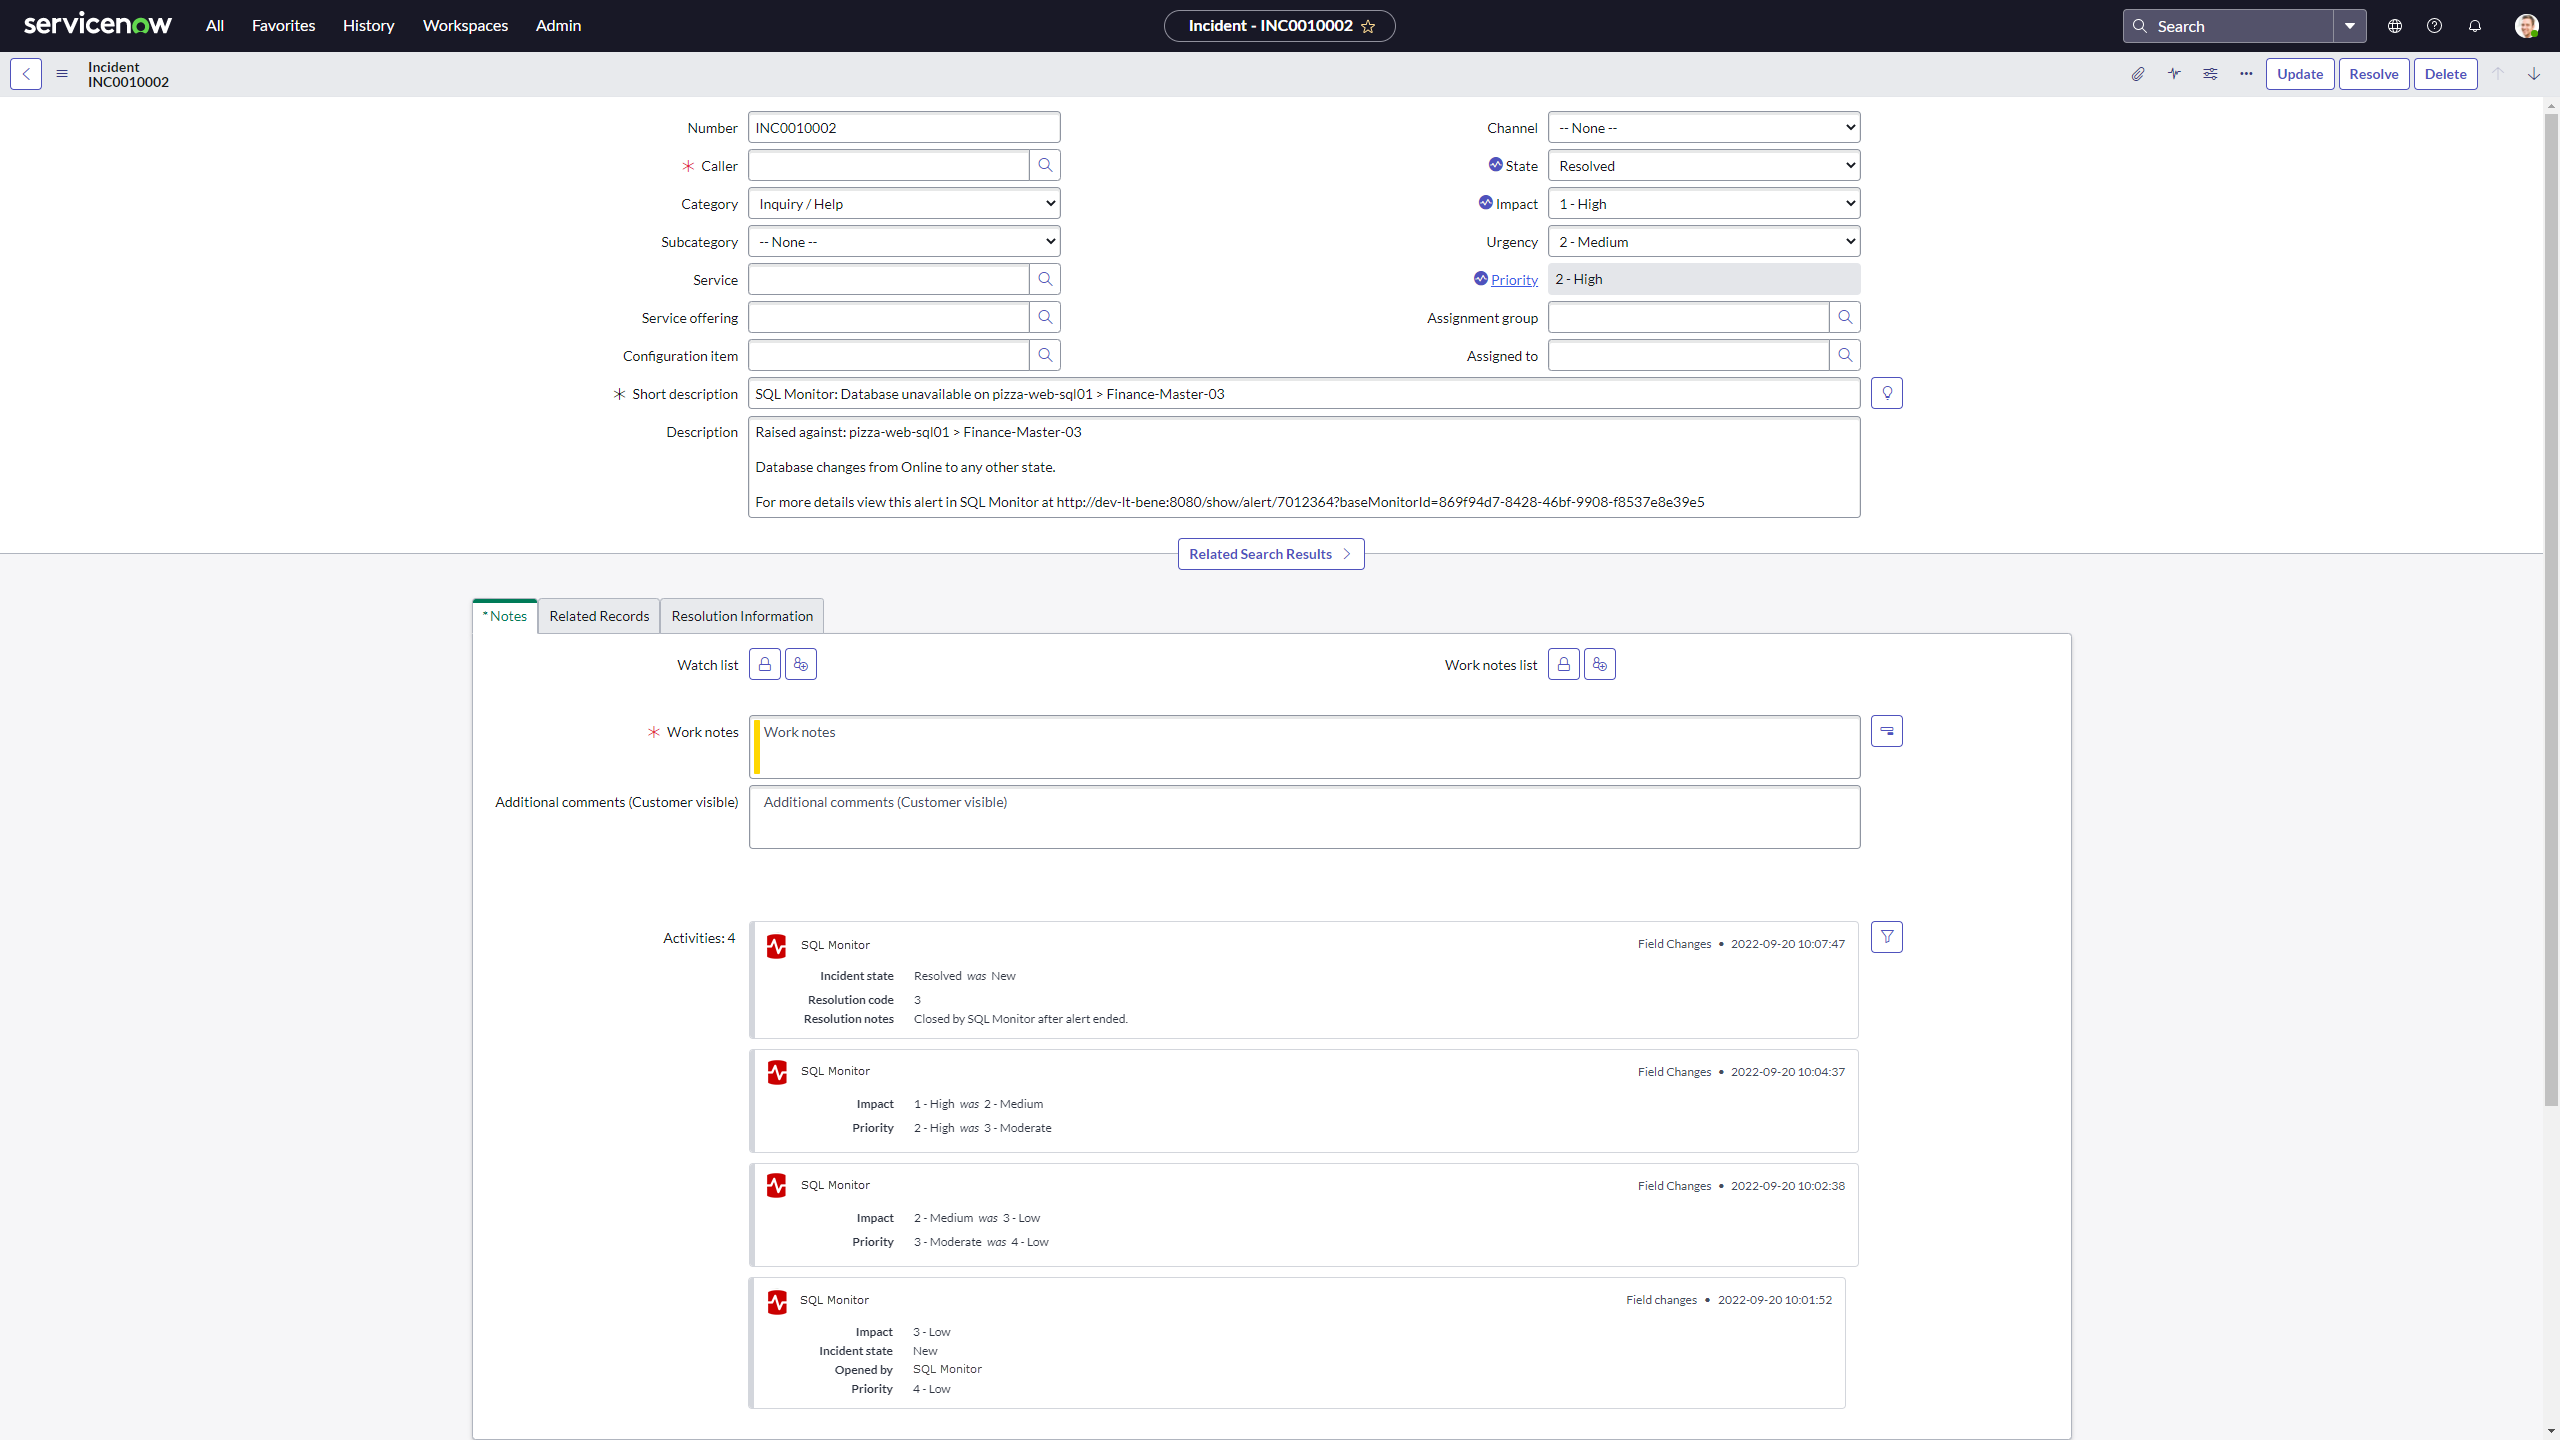
The following screenshot shows an example of how an incident created by the above script appears in ServiceNow. It shows a Redgate Monitor alert for an unavailable database which was initially raised at low severity, then escalated first to medium then to high severity as the time the database was unavailable for crossed different thresholds. Finally the alert was ended a couple of minutes later, when the database was brought back online, leading to the ServiceNow incident's state being updated to resolved.
All these changes are visible in the incident's activity log, and are also reflected in updates to the incident's fields, alongside the description providing a summary of information about the original alert. This description includes a link to view the alert's full details in Redgate Monitor, from which the problem can be investigated.