Filtering alerts
Published 28 March 2024
You can filter the alerts that are displayed in the Alert Inbox in two basic ways:
- By the selection in the Monitored servers list.
- By alert attributes (using system or custom filters).
These two methods of filtering the Alert Inbox always work in combination.
Persistent filtering
Filtering is persisted, so when you return to the Alert Inbox after selecting a different web page, the previous filtered list is displayed.
The Monitored servers list
When you first click the Alerts tab, Redgate Monitor always shows every uncleared alert across all your servers. You can then use the Monitored servers list controls the objects for which alerts are displayed.
To change the list of alerts displayed, under Monitored servers, click on a group, host machine, SQL Server instance, or database. Alerts are shown for the currently selected level and all levels below, and the current object selection is reflected in the Monitored Servers list.
If you select a host machine, for example, you will see:
- alerts raised for the machine itself (such as disk space or memory alerts)
- alerts raised for all instances running on it (such as job failed or error log entries)
- alerts raised for all databases on those instances (such as fragmented indexes or backup overdue alerts)
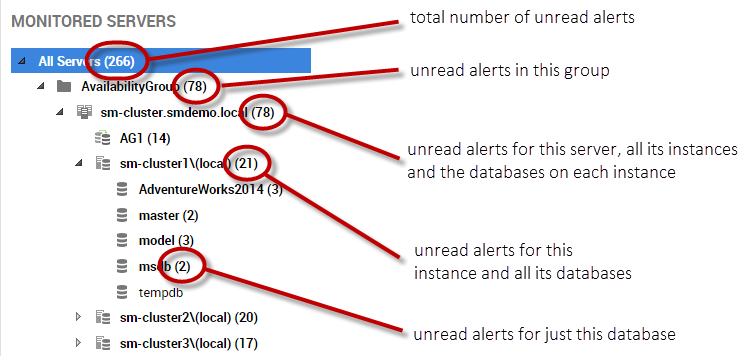
The number in brackets after an object in the Monitored servers list always shows the number of unread alerts, regardless of the current filters applied. As you drill down in the hierarchy, the number of unread alerts at each level is displayed:
The list of alerts is also filtered by whatever is set in the Filter drop-down.
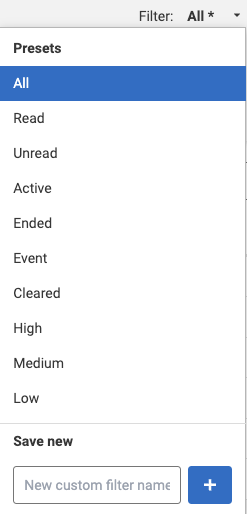
Preset filters
Preset filters are a quick way of getting back to a sensible starting point.
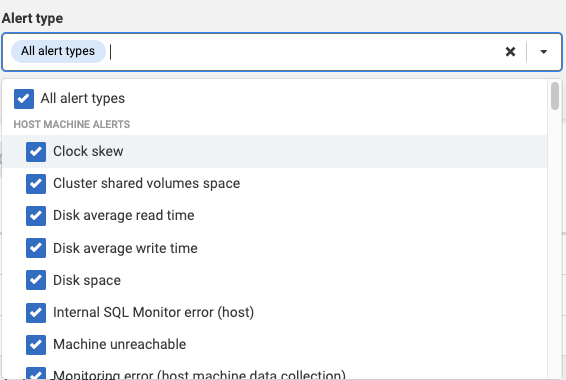
Filtering by type
To filter by type, select the checkbox for each alert type you want to show in the Alert Inbox.
If you are familiar with the alert names, type the first few characters of an alert name in the Search box. Only matching alerts are displayed.
Filtering by time
The time filter applies to the time each alert was raised. Under Time, select how you want to filter the alerts:
- Last Updated Within: select a fixed time period from the drop-down list.
- Last Updated from x to y: click in each box to choose a date and time. You can use only one box if required, for all alerts that were raised up to a fixed point in time, or all alerts starting from a fixed point in time.
Note: Alerts will be shown that were raised in the minute matching the "End" time; for example, if you want to view alerts between 10:00 and 14:00, alerts that were raised up till 14:01 will be shown.
Filtering by other properties
Choose the required checkboxes under Level, Status and Properties to filter the Alert Inbox. As soon as you clear or select a checkbox, the list of alerts is updated accordingly to match your selection.
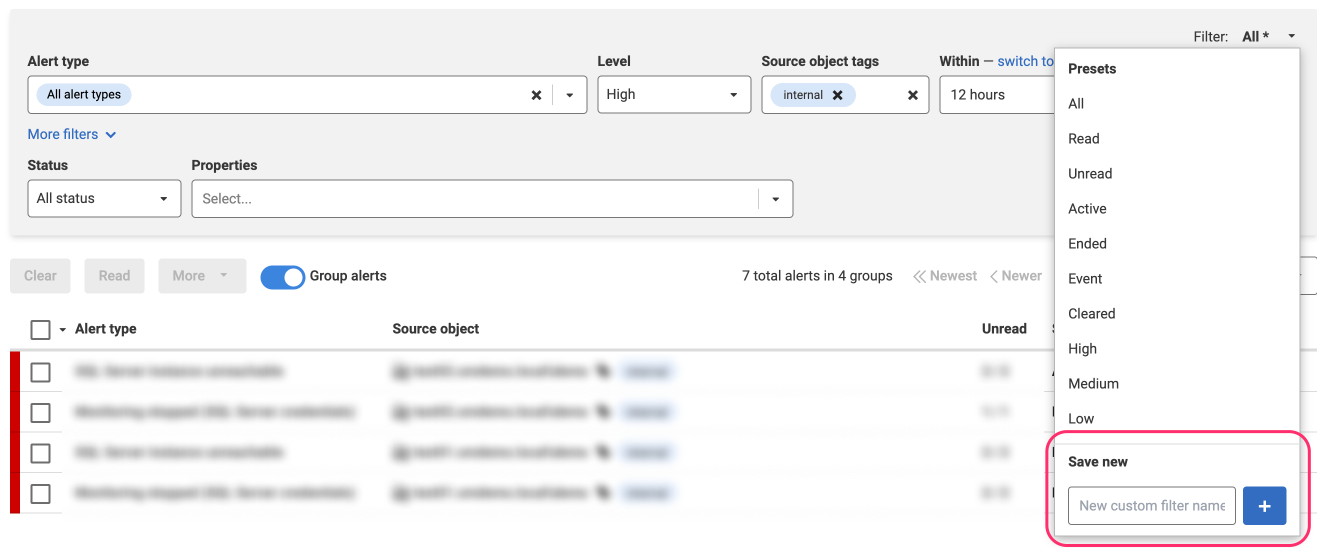
Custom filters
When you have selected the advanced filter options you want, you can save them as a custom filter.
This allows you to quickly reapply all the filter options you have selected, without having to reselect them again each time. You can save any number of custom filters, and this may help you prioritize which alerts you investigate – Deadlocks first, followed by all High alerts except deadlocks, then all alerts within the last two hours, and so on.
This documentation contains proprietary information and is protected by copyright law.
Copyright © 2026 Red Gate Software Limited. All rights reserved


