How SQL Monitor alerts work
Published 17 August 2020
SQL Monitor raises alerts when it detects problems across your servers. These will warn you of problems and also provide the supporting details you need to diagnose the cause and understand how to act. If you get a blocking alert, it will contain the full blocking chain; a CPU pressure alert will have a link to a snapshot of activity at the time of the alert, where you can find the most CPU-intensive queries that were running, their query plans, any associated waits, and so on.
The alerts are easily configurable. You can quickly enable or disable them and adjust their thresholds as you understand better the applications and the patterns of activity on your servers. You can suppress for periods, such as during maintenance windows.
The goal is that your SQL Monitor "Alert Inbox" should receive a manageable number of alerts on which you can always act. This way, you won't miss important alerts among noise, and you'll gradually reduce the alert volume by improving the system.
See the How to manage the Alert Inbox and review alert details video from Redgate University.
What alerts does SQL Monitor raise?
SQL Monitor alerts warn you about various issues on your host machines, SQL Server instances and databases. See: List of all alert types raised by SQL Monitor.
You can customize individual alert types for specific jobs, disks, databases, servers, clusters and groups. See: Customizing the alert settings.
If you create custom metrics to collect data specific to your environment, you can create alerts to warn you when the metric values pass certain thresholds. See: Configuring custom metrics and alerts.
Continuous alerts
Most built-in alert types, and all custom alerts, are continuous alerts. The alert condition for continuous alerts can be binary (either a job failed or it succeeded) or a configurable threshold (CPU utilization on a machine exceeded 80% for longer than 600 seconds). Continuous alerts are raised, and their status is listed as active, when the alert condition is met and will remain active until it is no longer met (ended), or until the alert is cleared manually, in the Alert Inbox.
Continuous alerts are raised at a defined level (Low, Medium or High) which you can configure. For continuous alerts, you can configure multiple thresholds, so this level can automatically escalate or downgrade while the alert status is active.
Examples:
- Job Failing alert type – raised when a SQL Agent job on a monitored instance fails to complete successfully (dbo.sysjobhistory). When SQL Monitor detects this condition, the alert is raised, its status becomes active and it will remain active until the job completes successfully (ended), which may be after a retry, or after the same job runs again, on the same instance, and succeeds.
- Long Running Query alert type – raised when the elapsed time for a query (sys.dm_exec_requests) exceeds the defined threshold value for an alert level. Remains active until the query completes (ended).
Event alerts
Event alerts are raised for incidents that occur at a specific point in time, and their status is always Event.
These are SQL Monitor's built-in event alert types:
- Availability group – failover.
- Cluster failover.
- Deadlock or Deadlock (Extended Events).
- SQL Server error log entry.
Event alerts are raised at a defined level (Low, Medium or High) which you can configure.
Alert types
The name of the alert type indicates the condition that will raise the alert. Alerts are raised when the sampled data value meets the defined alert threshold for the alert type, on that monitored object.
SQL Monitor support numerous alert types, categorized according to the monitored object on which the alert is raised:
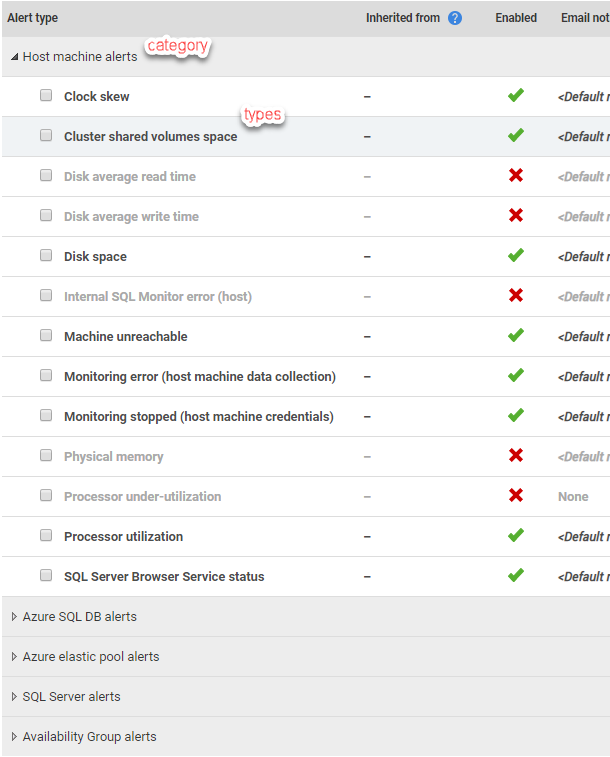
Alerts have categorization of Host Machine (based on Cluster, Machine and VMWare metrics), Availability Group, SQL Server (instance, database and job metrics), Azure SQL Database and Elastic Pool.
Alert settings (enabling/disabling, severity level and thresholds, notifications)
For each alert type, we can use the Alert settings page (Configuration > Alert settings) to enable or disable it, and then to customize various alert settings (level, threshold, alert notification recipients).
The alert severity level can be high (red), medium (amber) or low (blue).
The alert types for Event alerts and any continuous alerts with a binary alert condition can be assigned one of these alert severity levels, during configuration.
Continuous alerts with a threshold condition can have multiple alert severity levels, with a configurable alert threshold for each level. See: Configuring Alert thresholds.
Managing your alerting strategy
By default, the choices and settings for each alert type apply to All Servers. So, for example, if we configure a Job Failing alert type with medium severity level, with an email notification sent to the "DBA team", then these settings will apply to every Agent job, on every instance, on every machine, in every cluster, in every Server Group.
However, it is a good practice to refine your alerting strategy for each alert type, according to the business requirements of a Server Group. Each level in the server hierarchy inherits the settings from the level above it, so all servers in a Group will inherit the Group settings. We can refine this even further, if we wish, customizing the settings for the individual alert types for specific clusters, machines, disks, instances, databases and jobs.
See: Customizing the Alert Strategy for more details.
Alert status and properties
The alert status (Active, Ended, Event) for each instance of an alert type can be viewed in the Alert Inbox.
- Active: the issue is still currently a problem.
- Ended: the issue has been resolved.
- Event: a point-in-time event, such as an error being raised.
Depending on the type of alert, the Active duration of an alert can be quite short, for example less than a minute for long-running query alerts, or several days or even weeks for backup overdue alerts.
Each raised alert will also have various properties (Read, Unread, Cleared, Not Cleared, Comment, No Comment) each indicating the action taken in the Alert Inbox (reading and clearing alerts, adding comments detailing diagnostic actions taken and so on).
Next step
This documentation contains proprietary information and is protected by copyright law.
Copyright © 2026 Red Gate Software Limited. All rights reserved


