Performance diagnostics: queries and waits
Published 17 August 2020
Performance diagnostics help you investigate problems with your instances and databases that may be affecting performance:
- Query execution statistics and details can help you to evaluate the efficiency with which your workload utilizes server resources (CPU, I/O, Memory) and to identify problematic statements or execution plans.
- Wait statistics tell you how long SQL Server spent waiting to execute queries or other requests for resources or processes. Many waits occur as part of SQL Server's normal scheduling routine, but some can suggest underlying performance issues that are causing bottlenecks. The waits themselves might not tell you exactly what the problem is, but they can help you decide how to start troubleshooting.
The real power of a tool like SQL Monitor is that it pulls together into one place a lot of otherwise disparate information, allowing users to see the full picture. We can directly corroborate the wait statistics and query statistics with the behavior of relevant performance metrics over the same period, which provide specific resource usage measurements (disk transfer rates, amount of CPU time consumed, and so on), and which highlight the “queues” in our database system.
You can use SQL Monitor's back in time feature to compare the behaviour of all these metrics over a period of server slowdown, with a period when you know performance was "normal", and therefore detect anomalies. This will allow you to quickly locate the most contested resources on your system, and so highlight potential bottlenecks, and then determine the underlying cause of the problem.
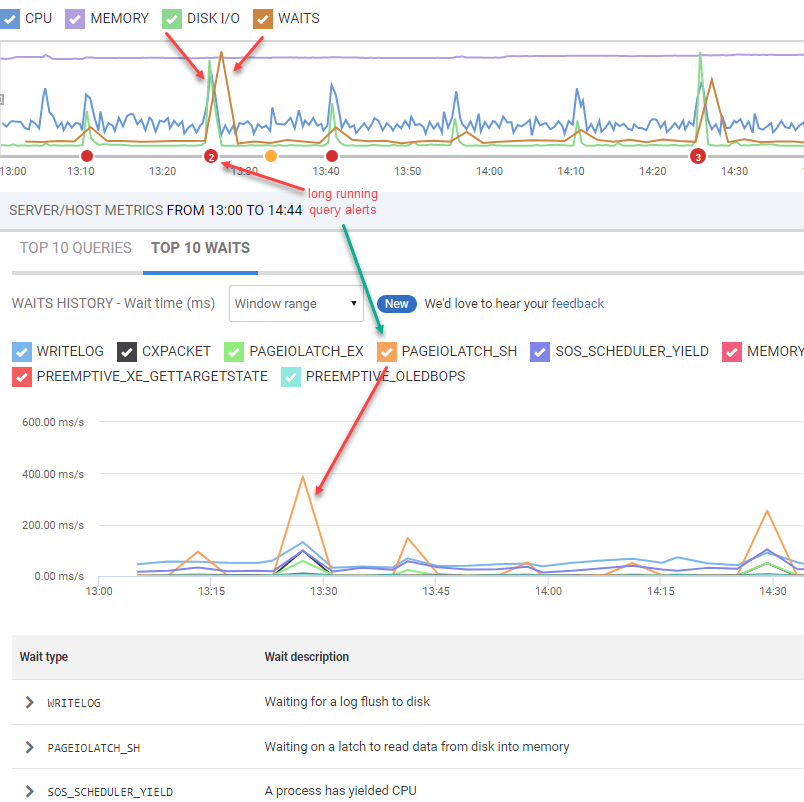
For example, let's say you're seeing Long Running Query alerts on an instance. You jump to the Overviews page for that instance, and immediately see that these alerts coincide with spikes in the PAGEIOLATCH waits (and some other I/O-related waits), in the Waits History graph, in the middle, and also with spikes in the Disk I/O sparkline. Given that a primary cause of PAGEIOLATCH waits is inefficient queries reading huge numbers of pages into memory in the buffer cache, a great place to start would be to drill into the queries associated with the alerts, and those in the Top 10 Queries tab. We can examine their query execution statistics, execution plans and so on, and look for ways to reduce the I/O demand through query tuning and indexing.
Next step
This documentation contains proprietary information and is protected by copyright law.
Copyright © 2026 Red Gate Software Limited. All rights reserved


