Create a custom metric and alert
Published 21 October 2021
How do I create a custom metric and alert?
If you don't want to create a custom metric and alert from scratch, we've provided a website, SQL Monitor Metrics, containing a range of metrics that you can install automatically. See Using the SQL Monitor metrics website.
A simple wizard guides you through each step of the creation process.
The Redgate University video Adding a custom metric and custom alert demonstrates how to use this wizard.
To create a custom metric:
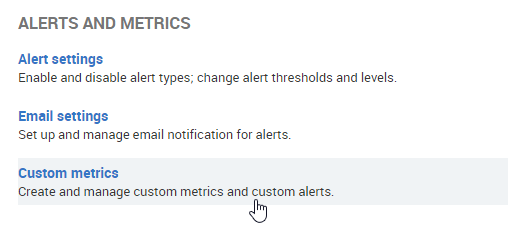
- Go to the Configuration tab. Under Alerts and metrics, select Custom metrics:
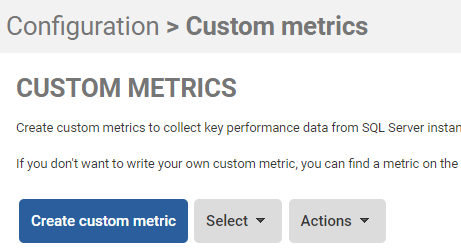
- Click the Create custom metric button:
This documentation contains proprietary information and is protected by copyright law.
Copyright © 2026 Red Gate Software Limited. All rights reserved


