Analyzing metrics
Published 21 October 2021
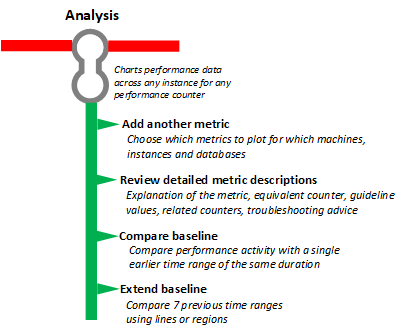
The Analysis graph charts performance data on a wide range of key metrics for monitored servers and databases, including metrics created by you (see: Create a custom metric and alert). You can show graphs containing multiple metrics to help understand performance problems, and compare metric activity over different time ranges by using a baseline.
Watch the How to use Analysis graphs and baselines video at Redgate University.
This documentation contains proprietary information and is protected by copyright law.
Copyright © 2026 Red Gate Software Limited. All rights reserved


