PostgreSQL instance and host machine metrics
Published 02 March 2023
Instance Metrics
The time range of these sparkline graphs matches the selection window on the main graph
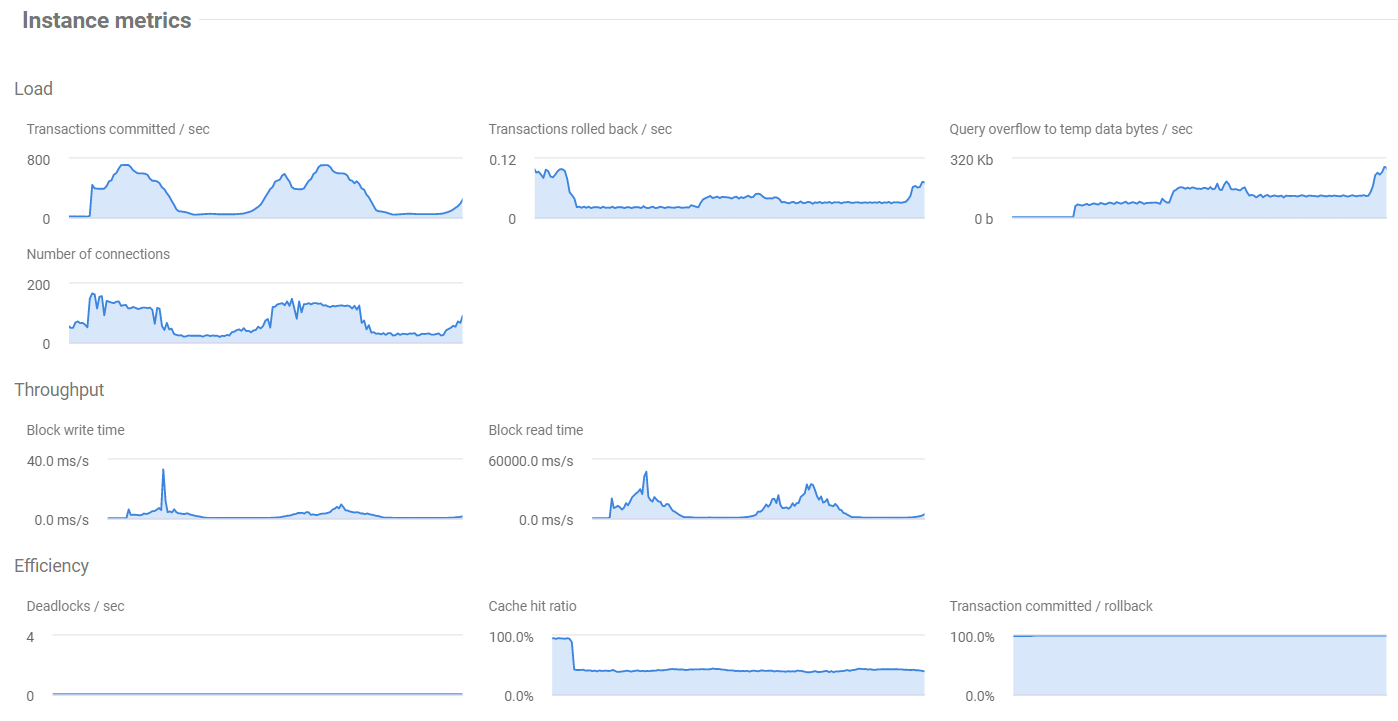
Transactions committed / sec
Shows the number of successful (committed) transactions per second.
Transactions rolled back / sec
Shows the number of aborted (rolled back) transactions per second.
Query overflow to temp data bytes / sec
Shows the volume of data being written to temporary storage to support query execution.
Number of connections
The total number of user connections to a Postgres Instance at a given time.
Block write time
The time in ms/s which queries have spent waiting on I/O to write blocks of data.
Block read time
The time in ms/s which queries have spent waiting on I/O to read blocks of data.
Deadlocks / sec
The number of occurrences of two or more transactions being unable to proceed because they are each waiting on a resource on which the other has already acquired a lock.
Cache hit ratio
The ratio of data reads which were served from PostgreSQL's memory cache (a hit) vs having to request data from the host Operating System.
Transactions committed / rollback
Shows the ratio of the number of successful (committed) transactions to the number of aborted (rolled back) transactions at a given point in time
Host machine metrics
Network utilization
The percentage of total bandwidth usage
Avg CPU queue length
The number of threads in the processor queue waiting to be executed
Memory pages / sec
The rate at which pages are read from or written to disk to resolve page faults.
Disk Usage
For each logical disk on the host
Space used
Amount of space used (dark) and remaining (light), with amount free and total size in text.
Avg. read time
The average time in milliseconds of a read operation from the logical disk.
Avg. write time
The average time in milliseconds of a write operation to the logical disk.
Transfers / sec
How many read and write requests are being completed per second on the logical disk.


